✦
Announcing: Your new feature
The
Graph Maker
From messy data to beautiful graphs in a click, Graphy is the fastest way to tell stories with data.
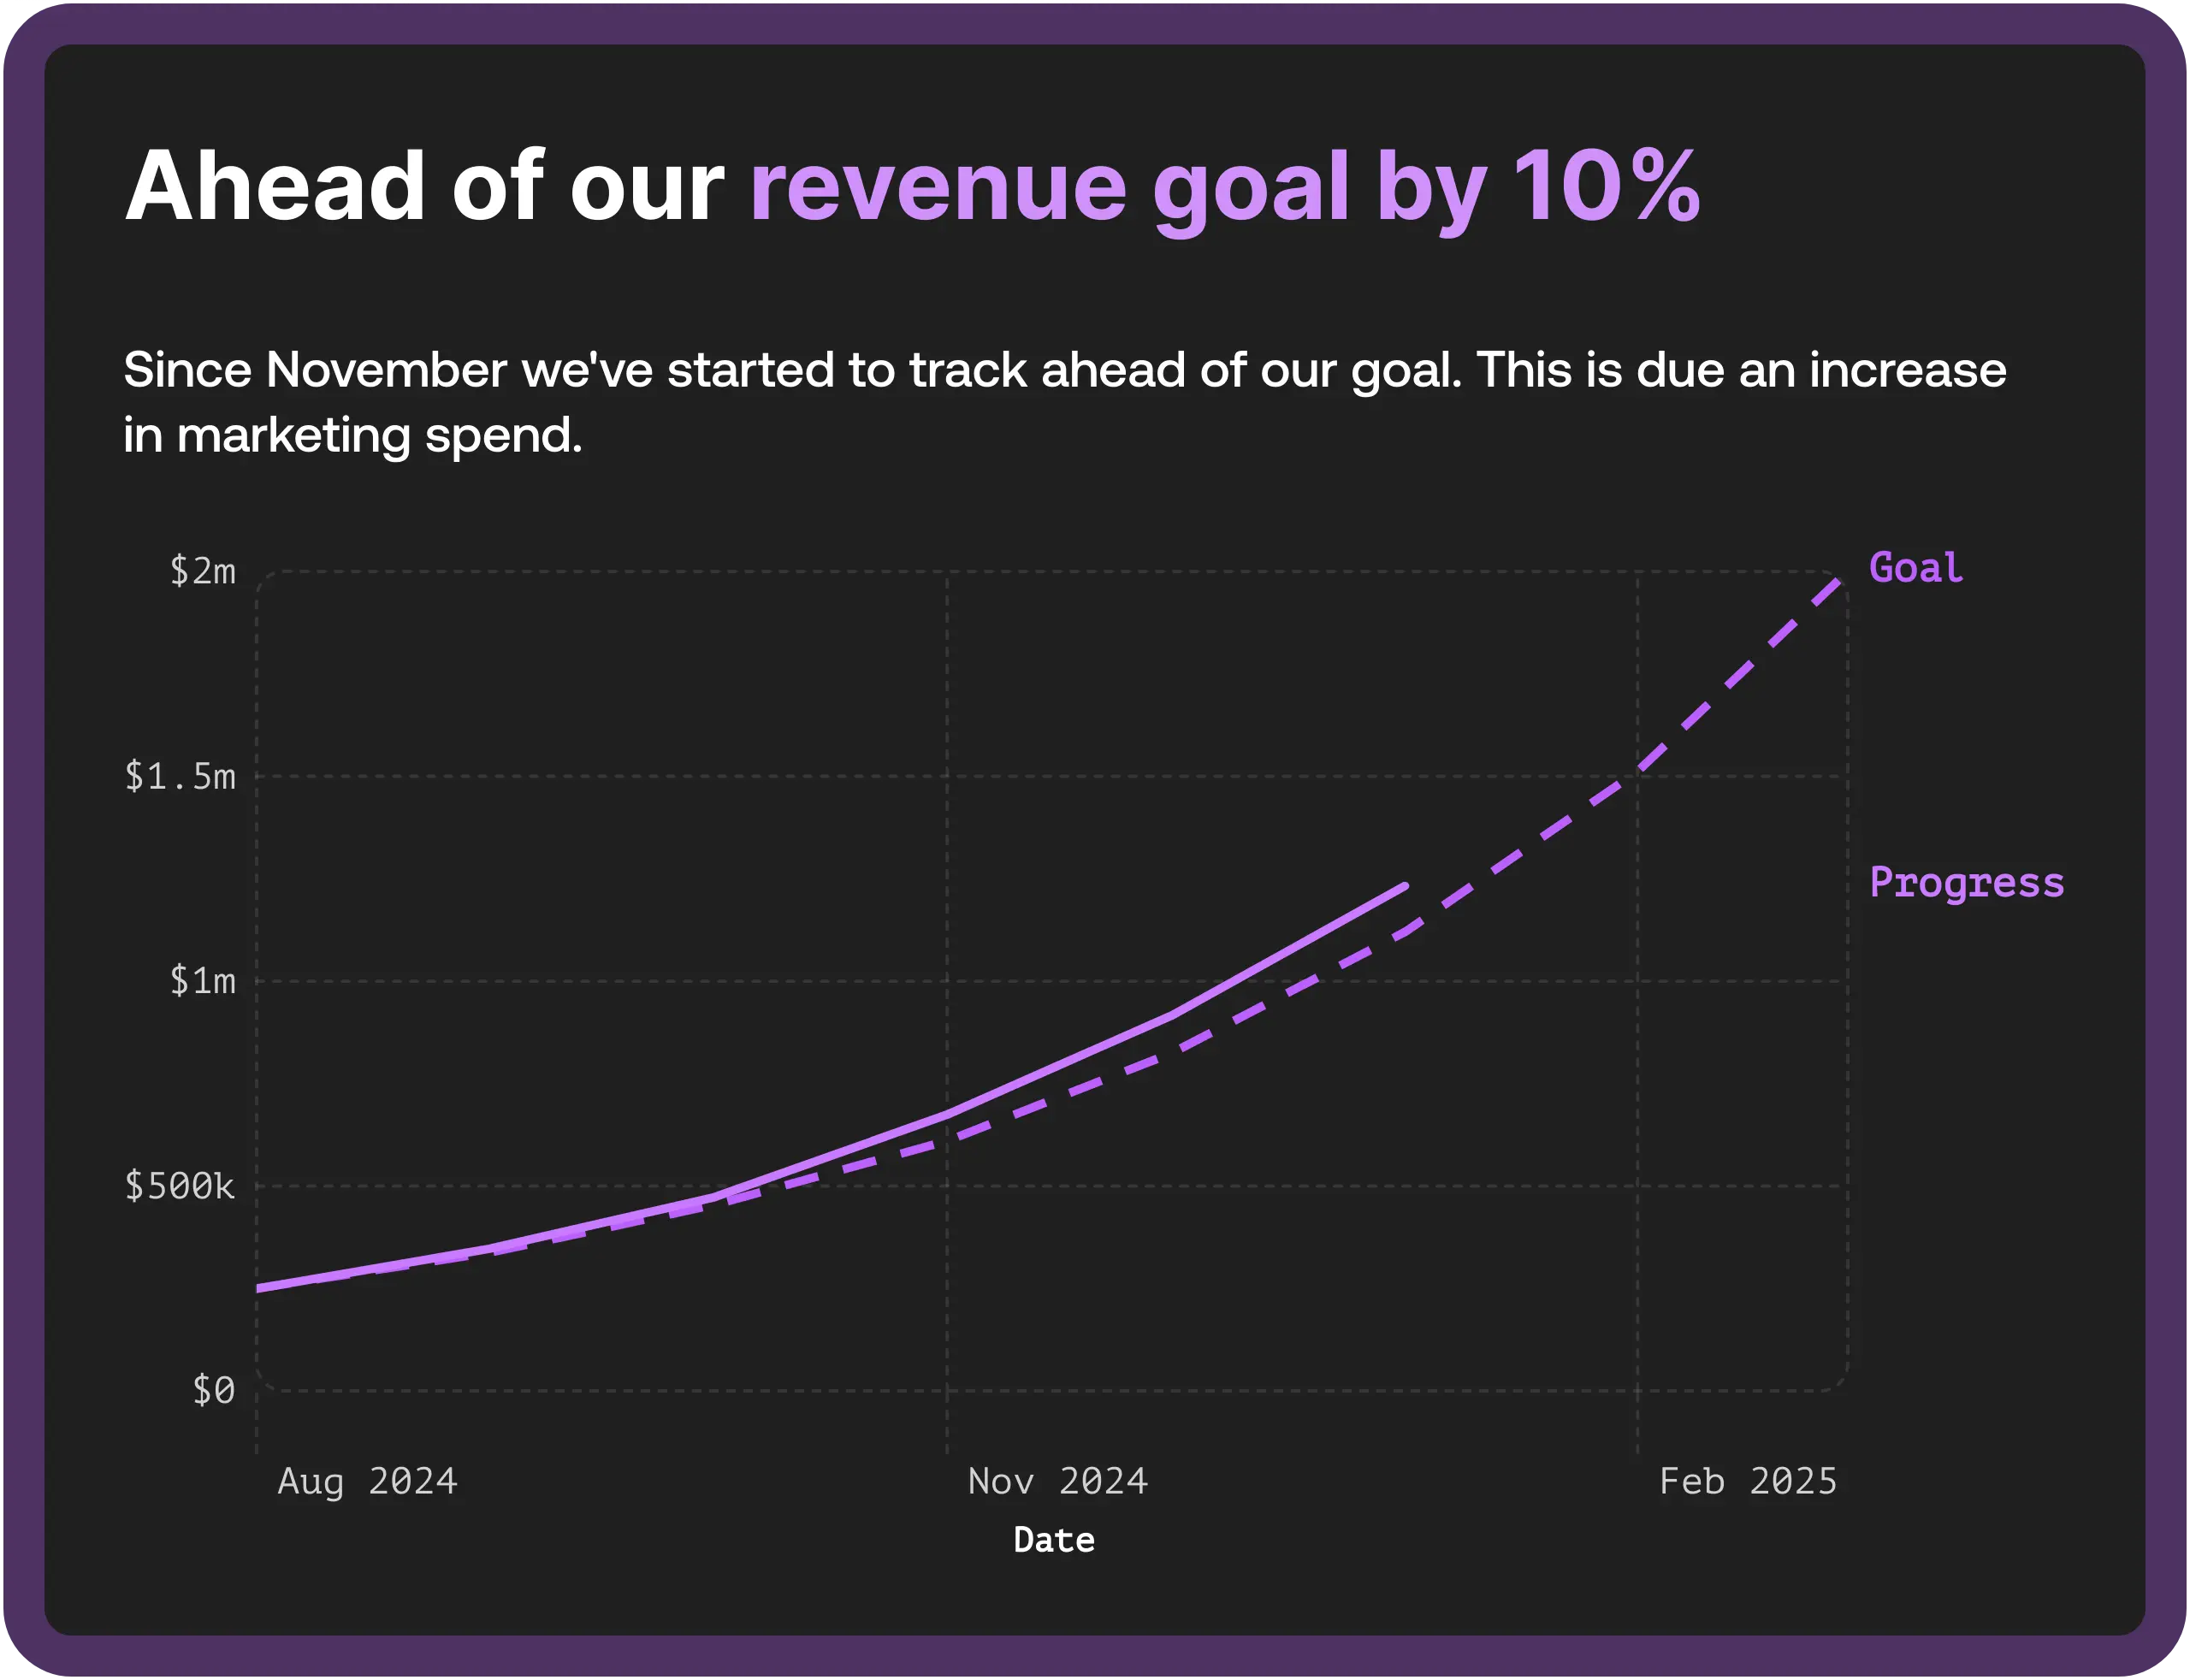
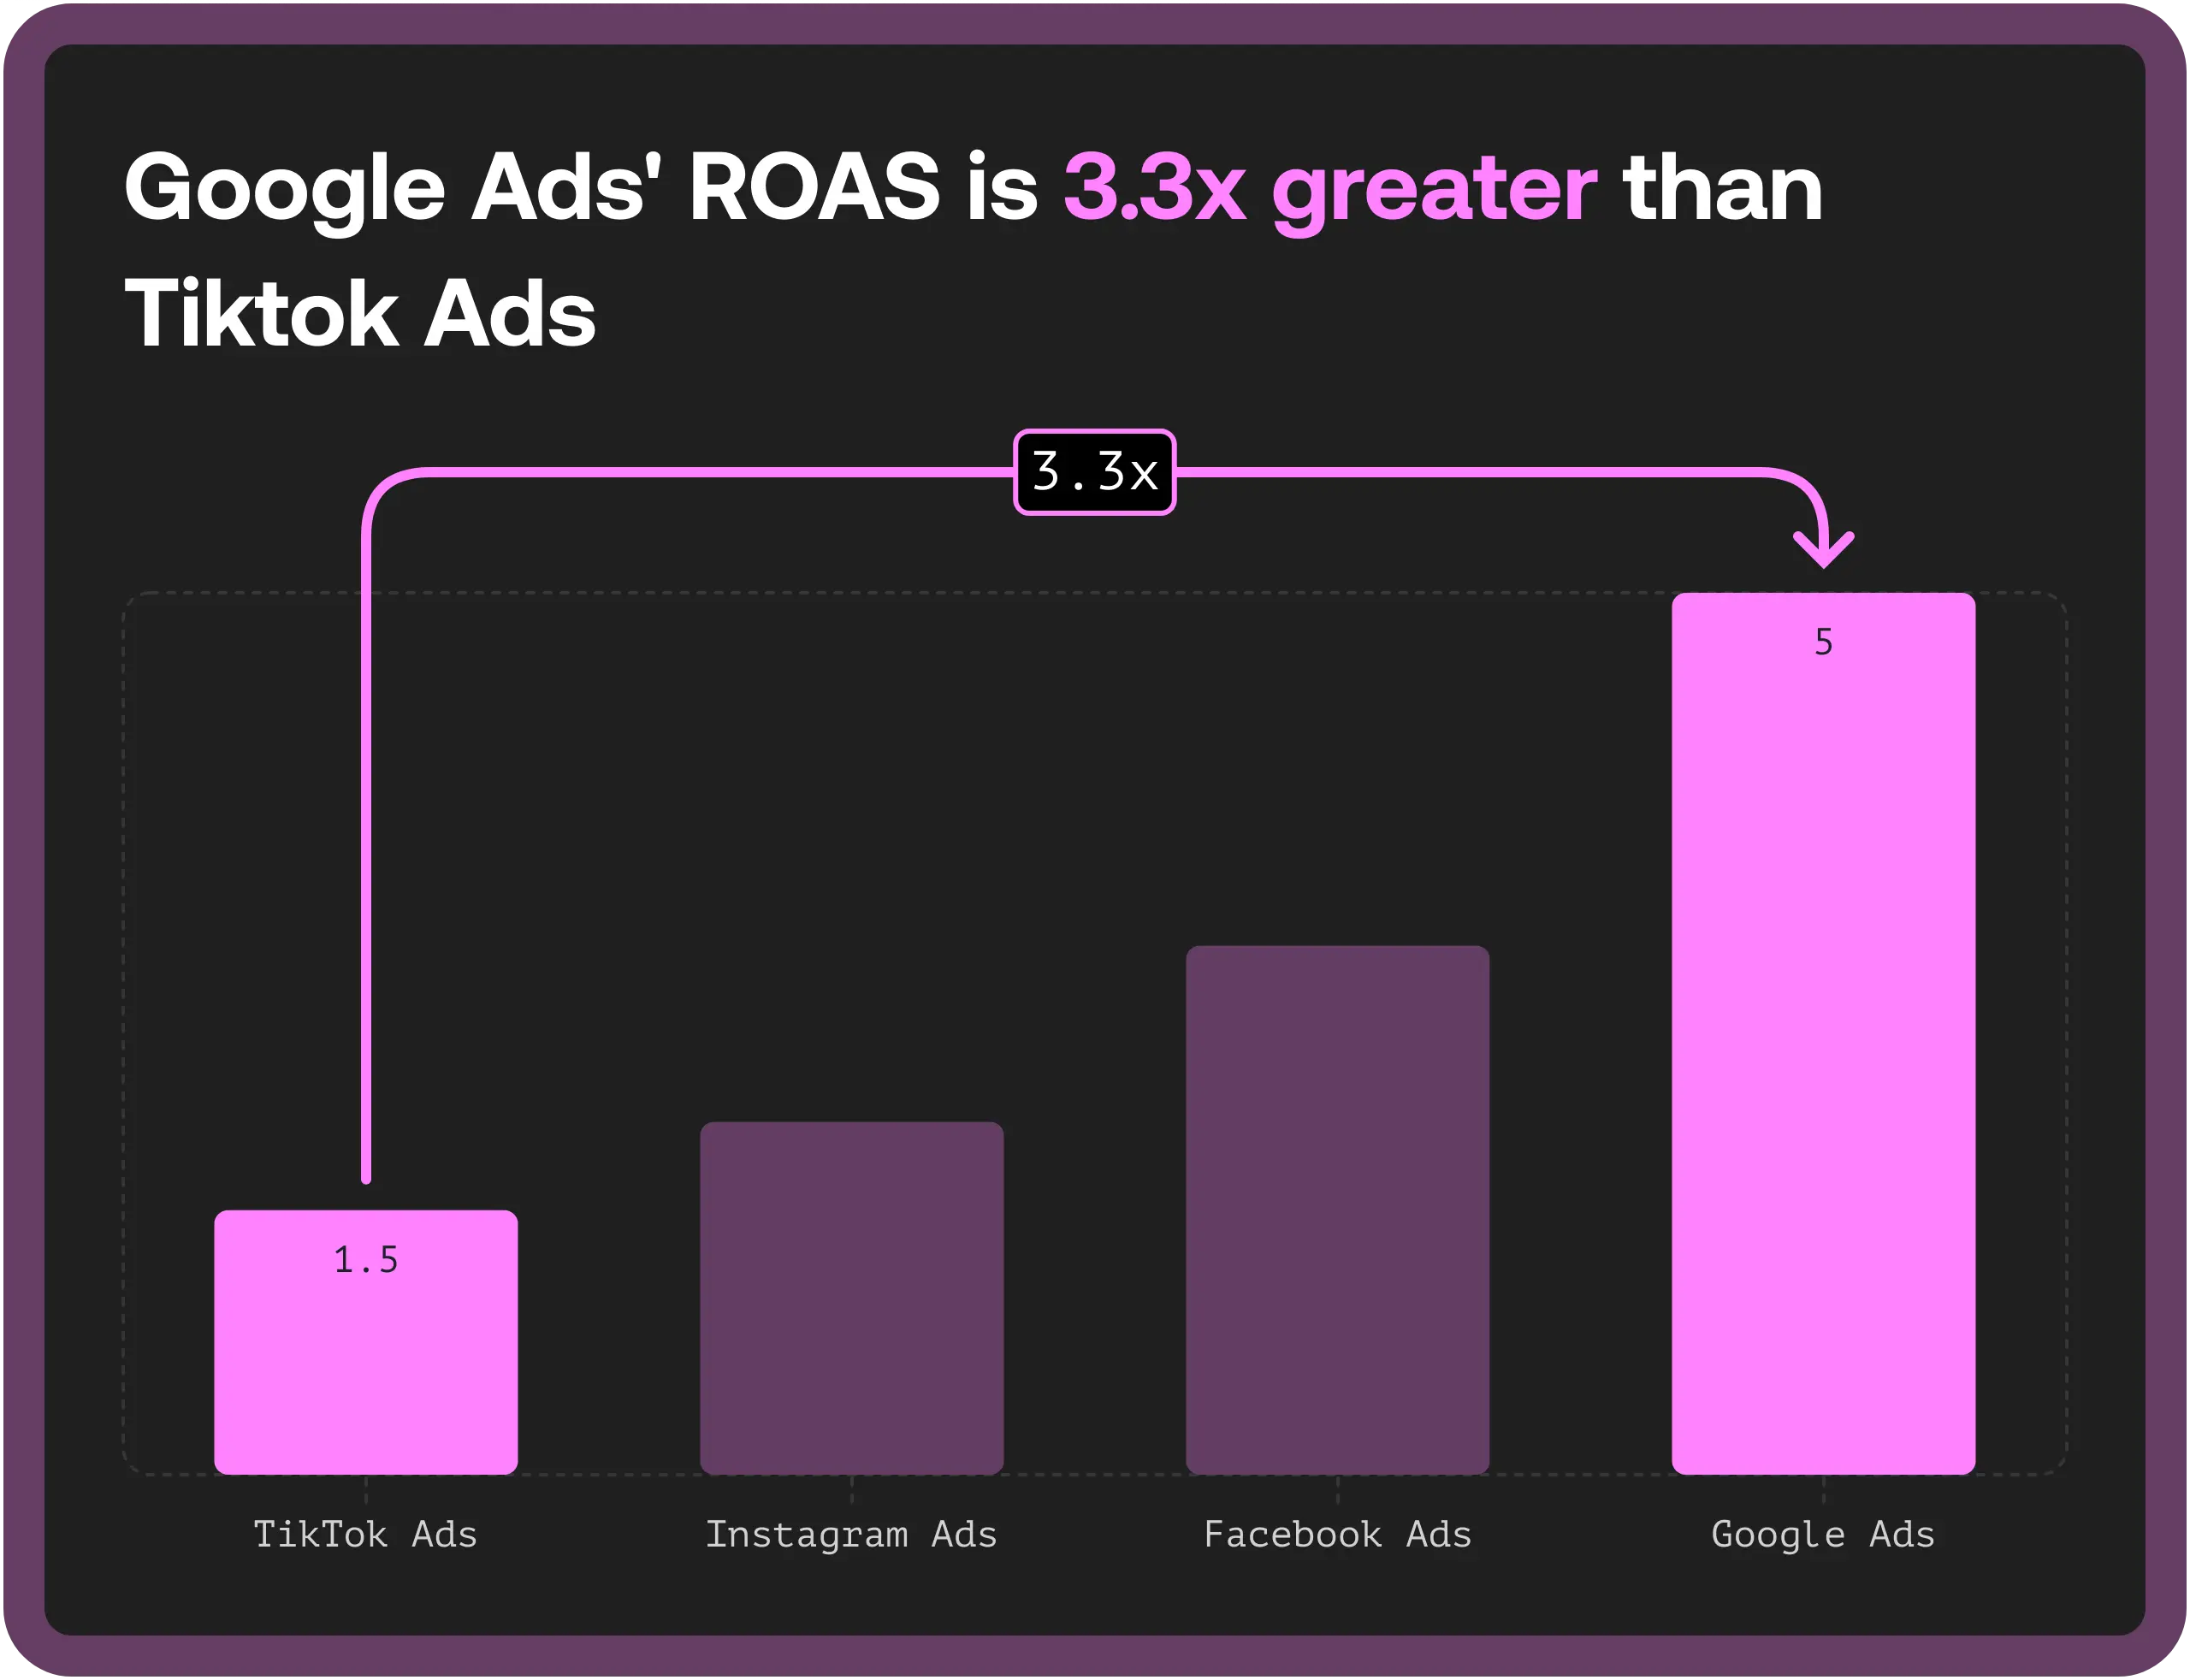


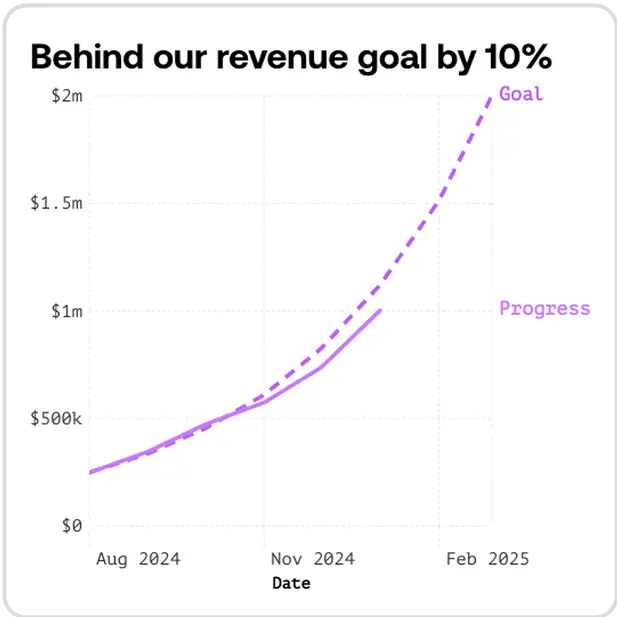
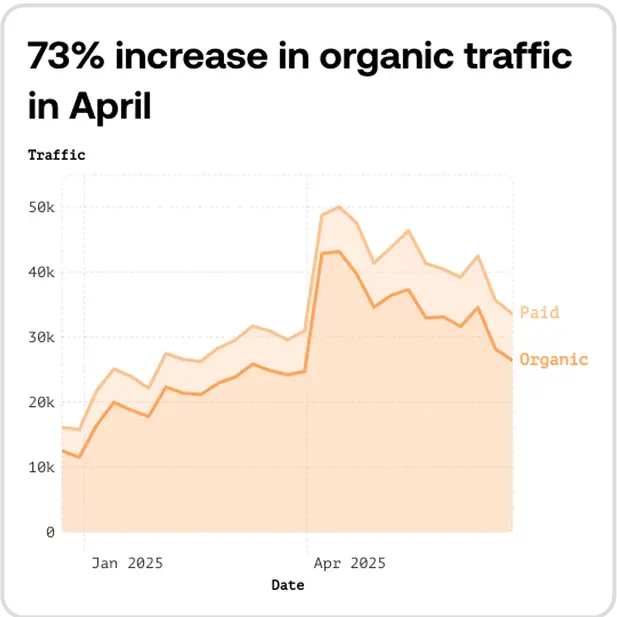
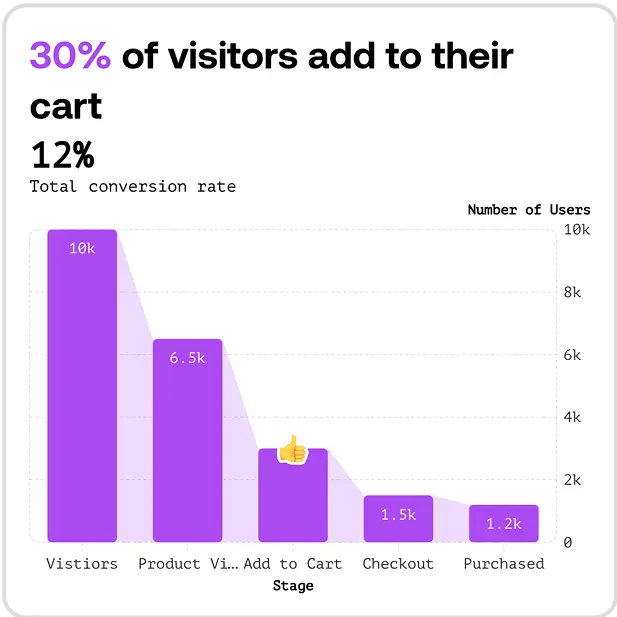
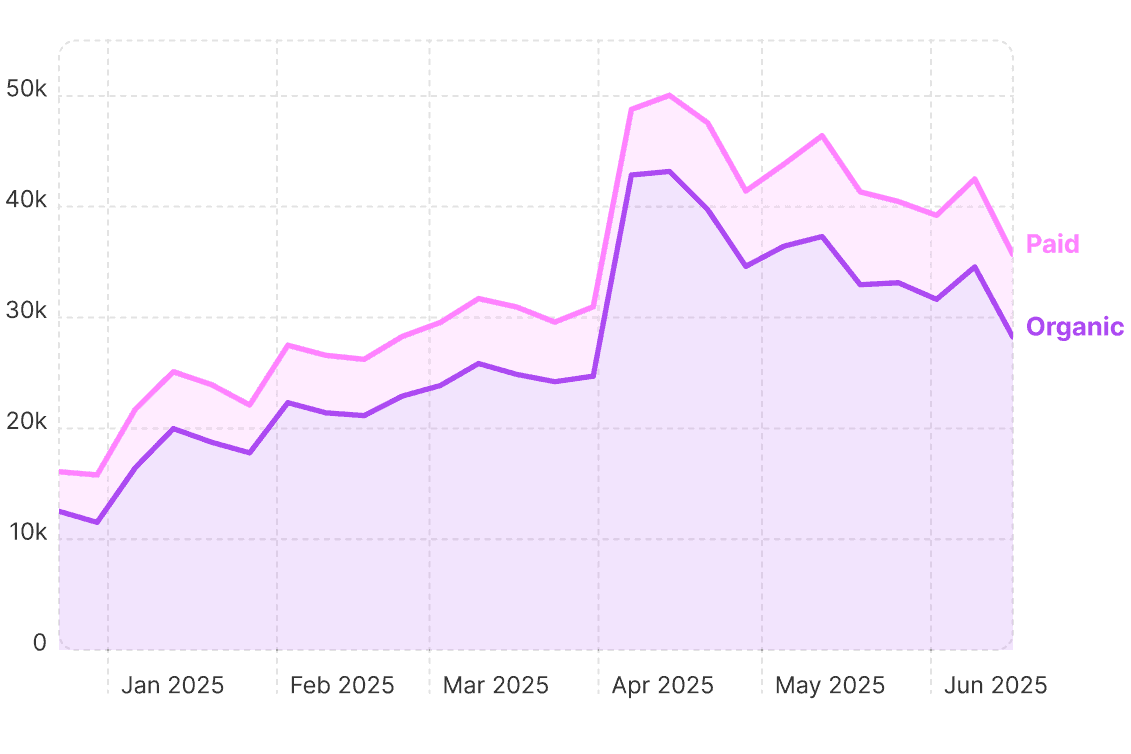
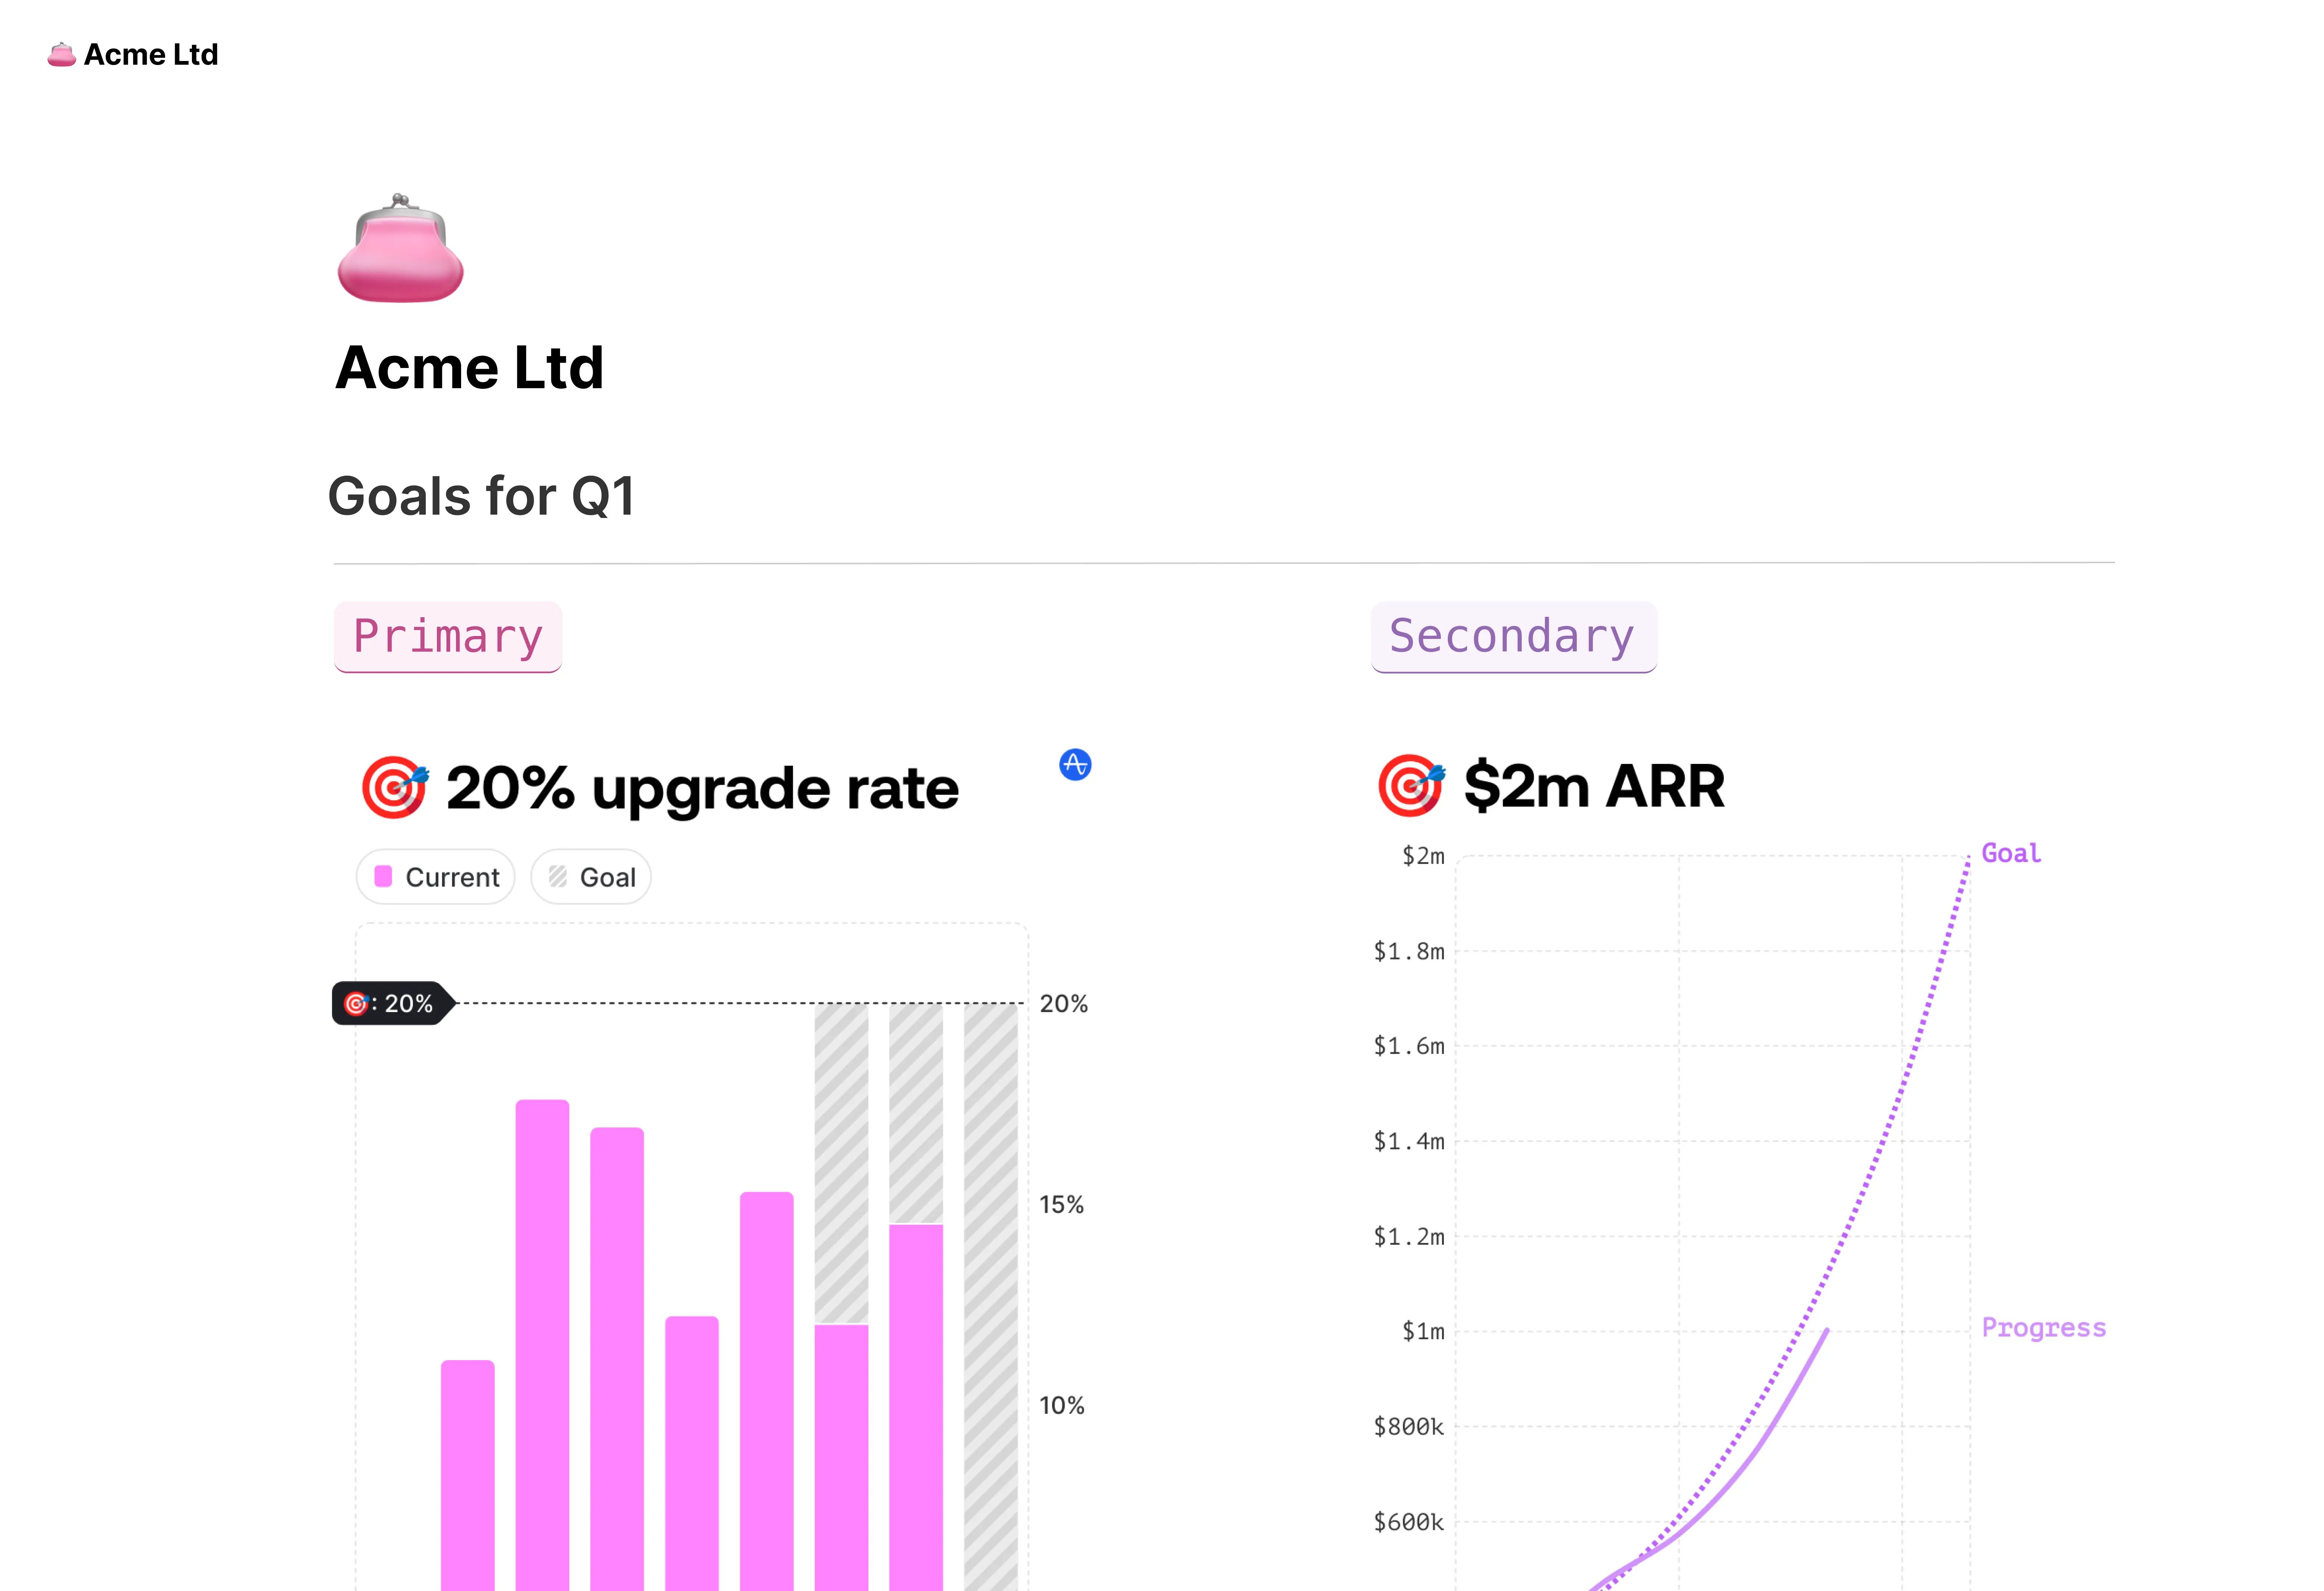
Compare
Communicate insights and focus attention on key data points with visual annotations


Oh and it's…
How it works.
1
Add your data
Link a live Google Sheet, upload a CSV or Excel file, paste or type values, call our API, or ask AI to search for data.
2
One Click
to instantly
generate beautiful graphs
Our AI inspects every row and spits out the three clearest charts complete with headline take-aways. Want something else?
Or ask AI:
3
Make your data shine
Placeholder text
4
Export or embed — your call


Built to be shared where your work happens.
Collaborate and make decisions together in Graphy, or share graphs where the work is happening as embeds, interactive links, or images.
Benefits
Communicate insights and focus attention on key data points with visual annotations
Ai gives you precise / accurate answers
Communicate insights and focus attention on key data points with visual annotations
Secure by default
Communicate insights and focus attention on key data points with visual annotations
Great for both technical and non-technical users
Communicate insights and focus attention on key data points with visual annotations
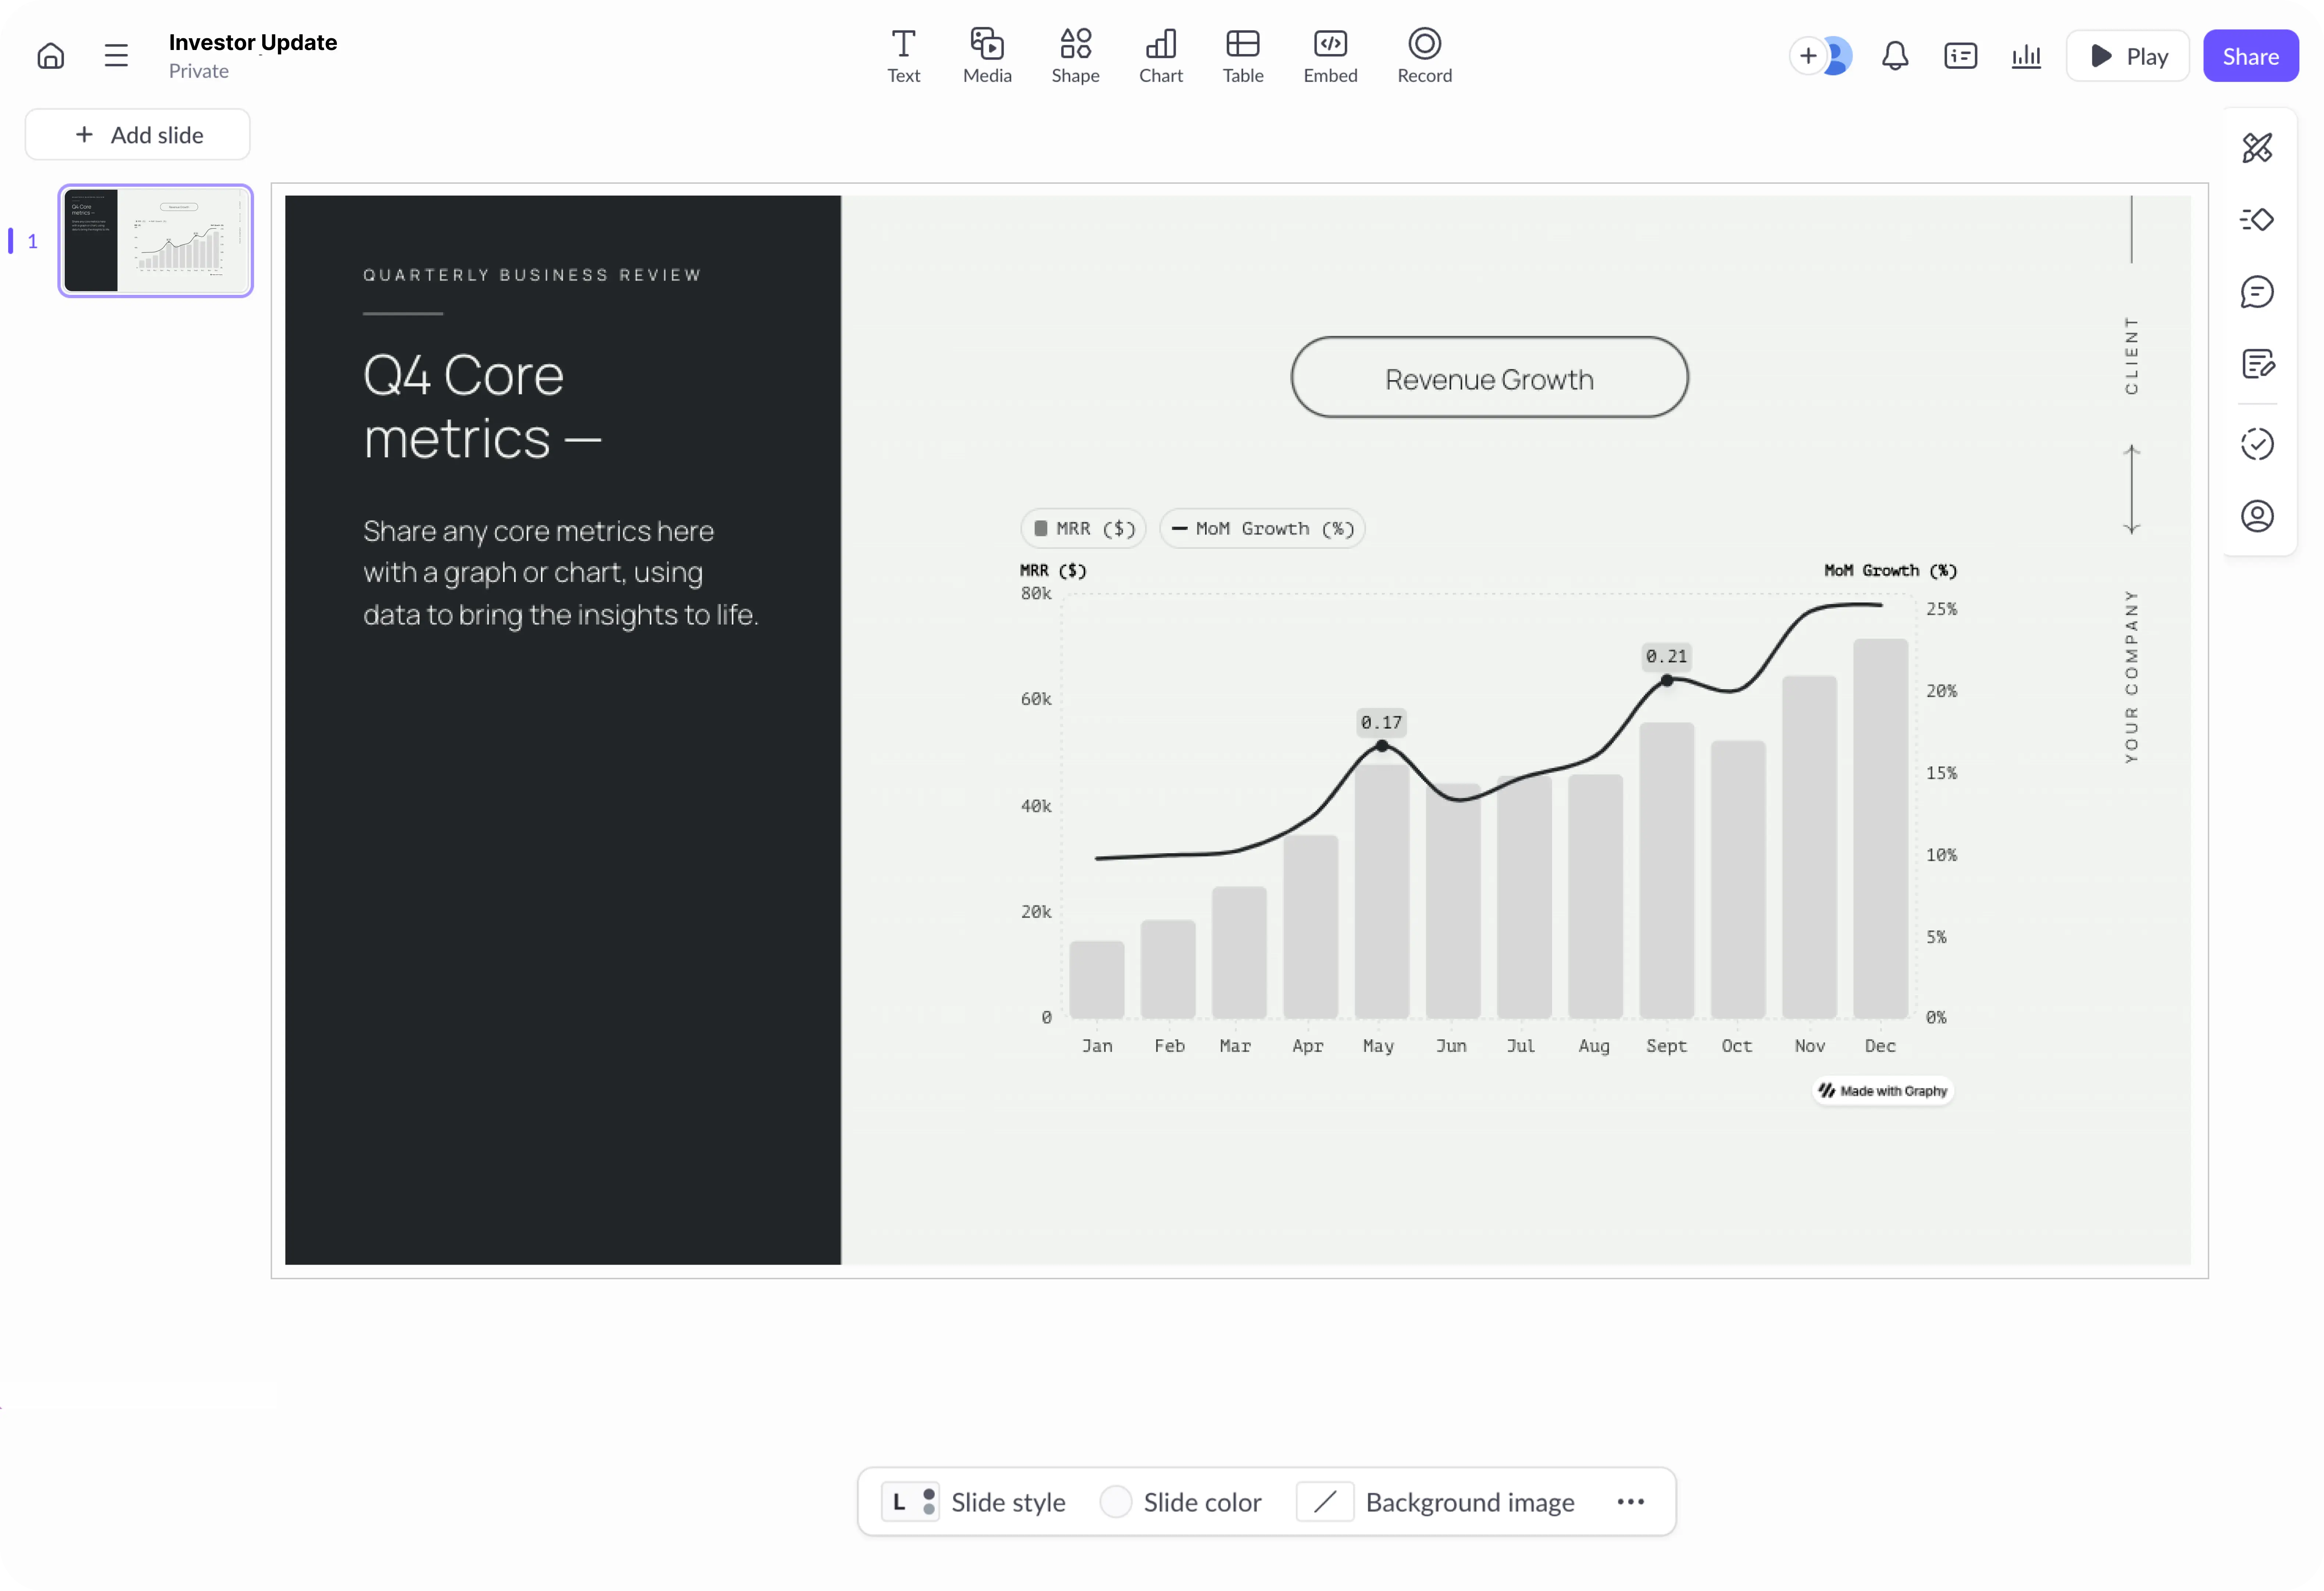
Use cases
Communicate insights and focus attention on key data points with visual annotations
Presentations
Make beautiful graphs
Blog
Leave an impression
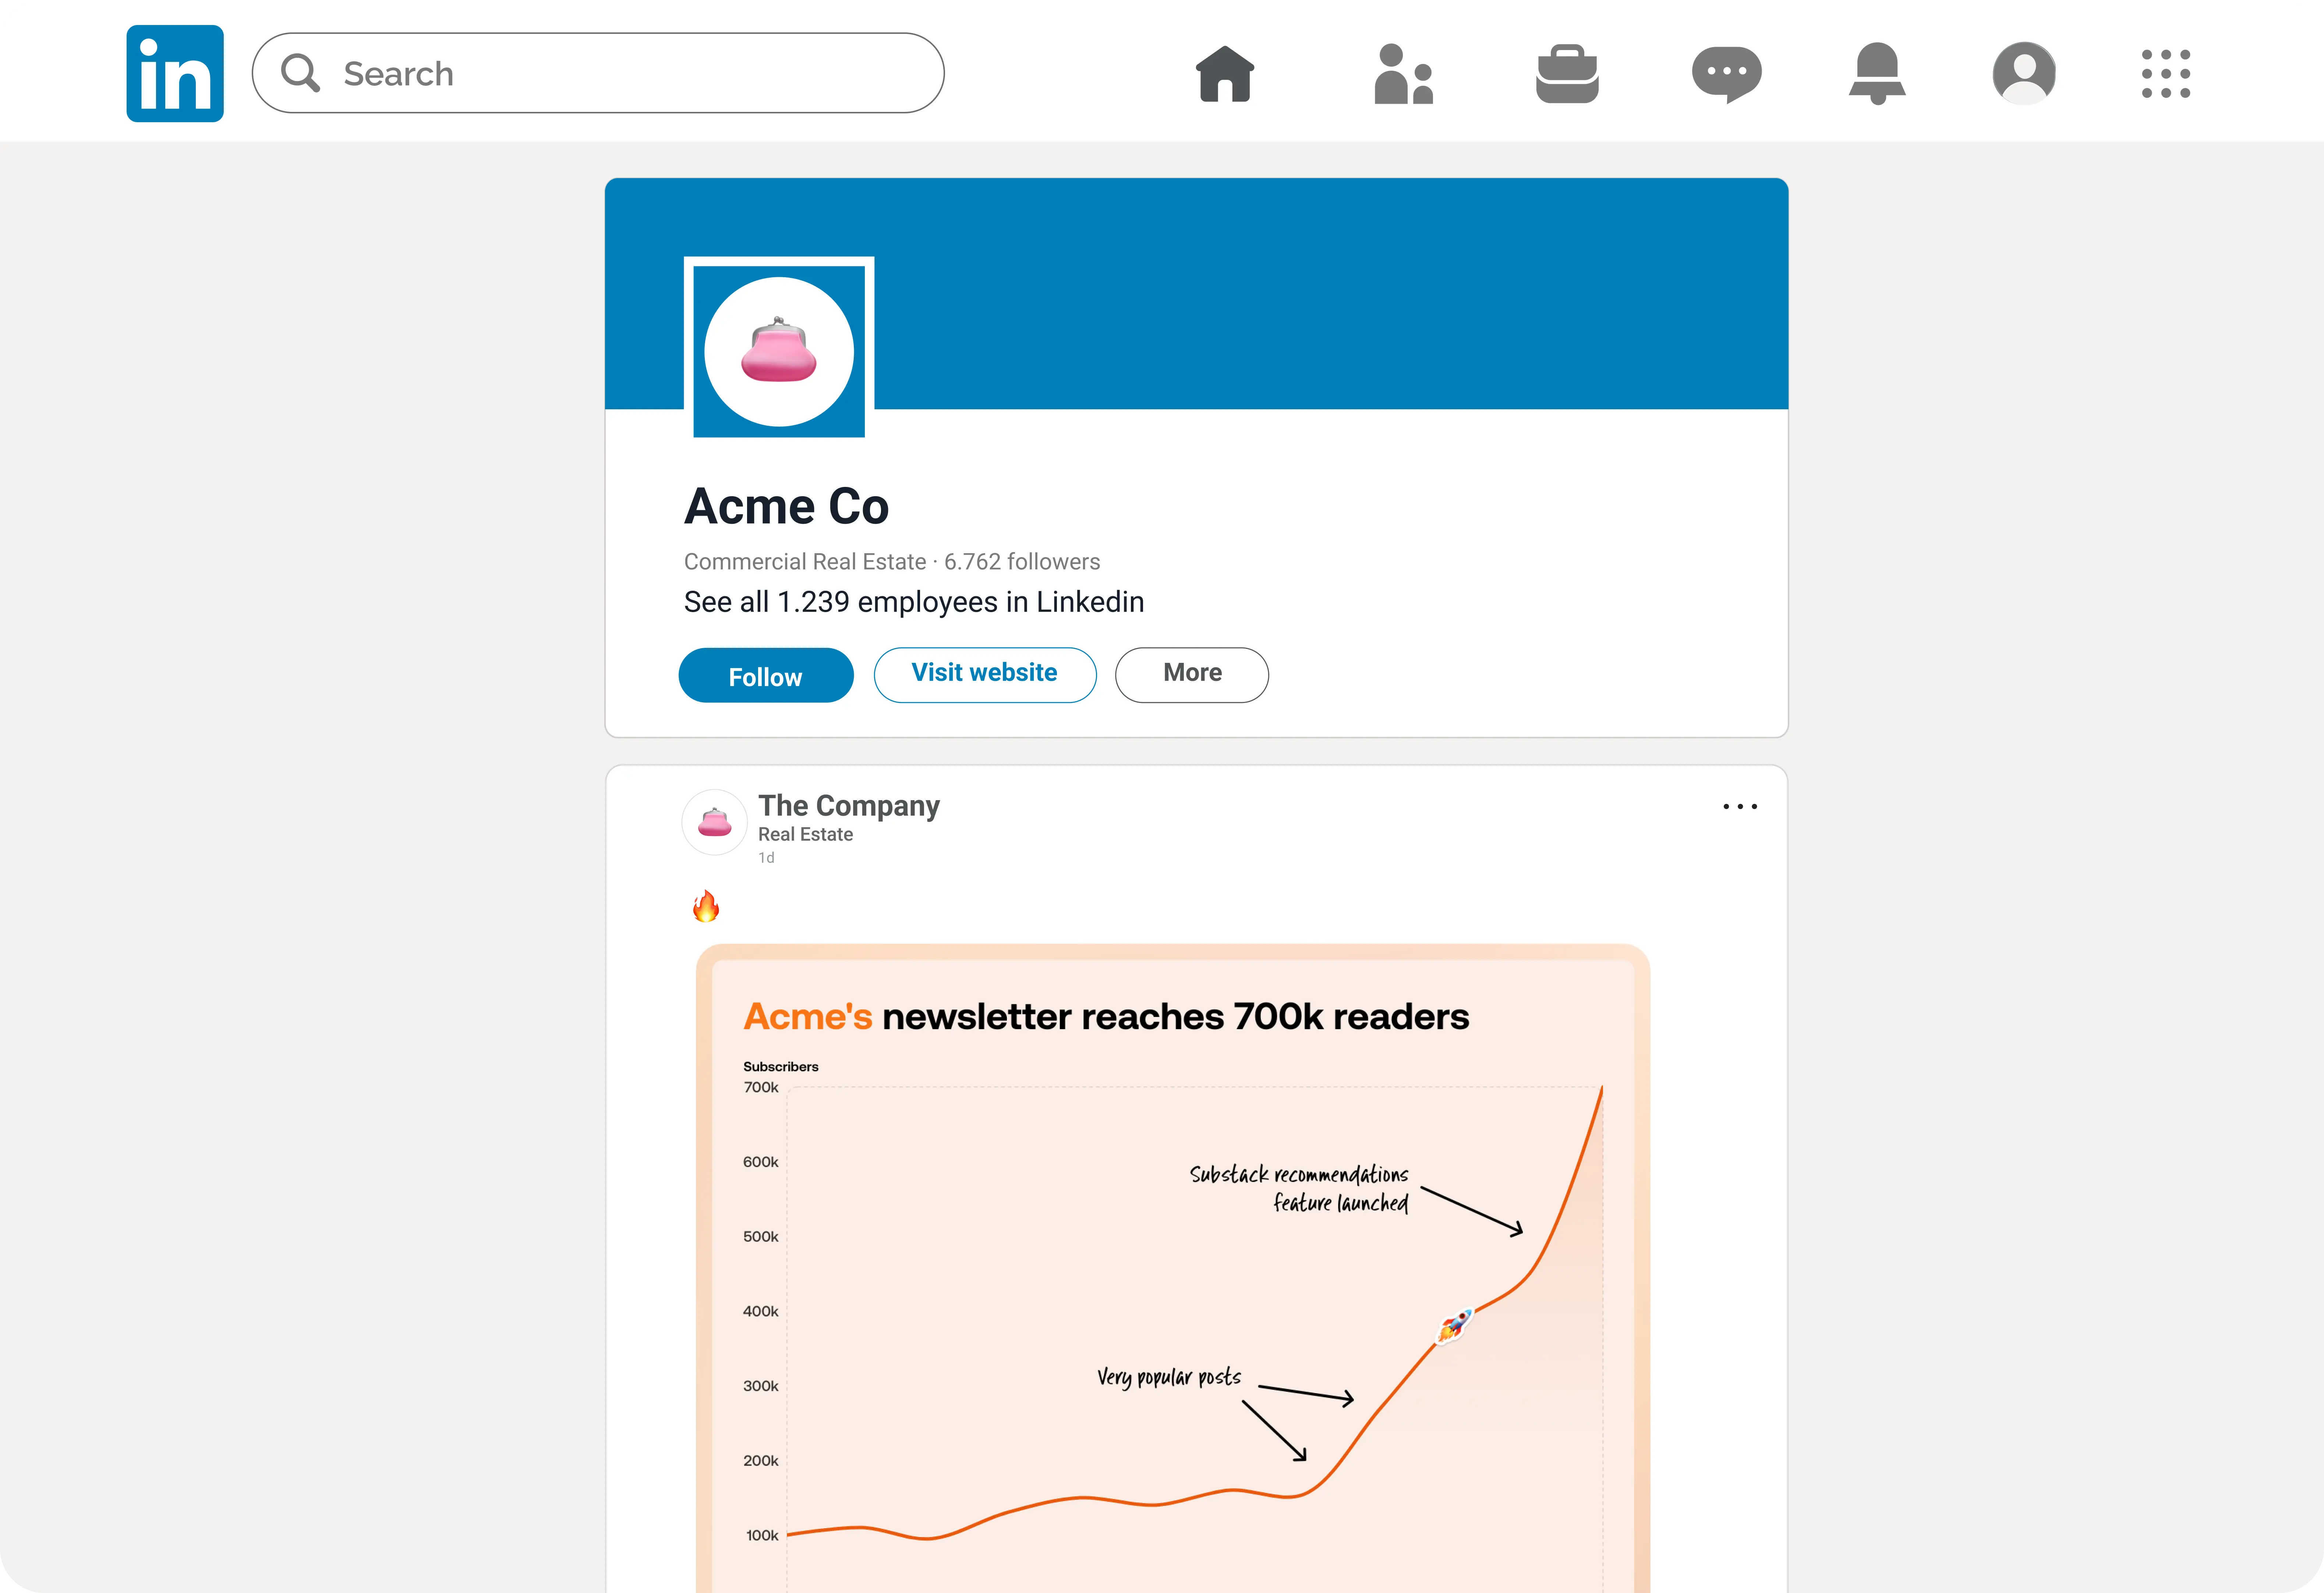
Social media
Engage your audience
Docs
Write easy to read docs
Wall of Love

Cindy Ibanez
Global Head of Marketing at
Wynwood House
Thanks to Graphy 5 days of reporting were done in 4 hours. My team were in love! They were like, oh my God, what is this, this is the future!

Ryan Hoover
Founder of Product Hunt
I’d rather eat cardboard than create another pivot table Thanks, Graphy (I don’t like cardboard)

Nick Lafferty
Founder at Early Exit Club
Graphy is the first tool I use when I'm looking to quickly create stunning visuals for my newsletter, social feeds, and my consulting business. I'm not stuck using Google Sheet's terrible default graphs anymore!

Guillermo Rauch
CEO at Vercel
Stunning product.