When
When
When
did
did
did
it
it
it
become
become
become
so hard
so hard
so hard
to
to
to
know
know
know
how
how
how
your
your
your
business
business
business
is
is
is
doing?
doing?
doing?
All you wanted was a few numbers, visualized.
Instead, you spent a ton of money and ended up with outdated charts, dashboards you can’t access, endless spreadsheets floating around, ”just learn SQL”, and that weekly email from Greg (sorry Greg, we know you’re trying!)
And let’s be honest, it’s not working.
You spend your time running from meeting to meeting with 50 browser tabs open, rifling through blurry screenshots of dashboards and dreaming of when the analytics team will finally integrate that tool you use.
Oh and don’t even start with the reporting. Who even reads those anyway?
How are you supposed to turn your business into a rocketship if you can’t even get on the same page about where you are today and where you’re aiming to get tomorrow?
There has to be a better way.
That’s why we built Graphy.
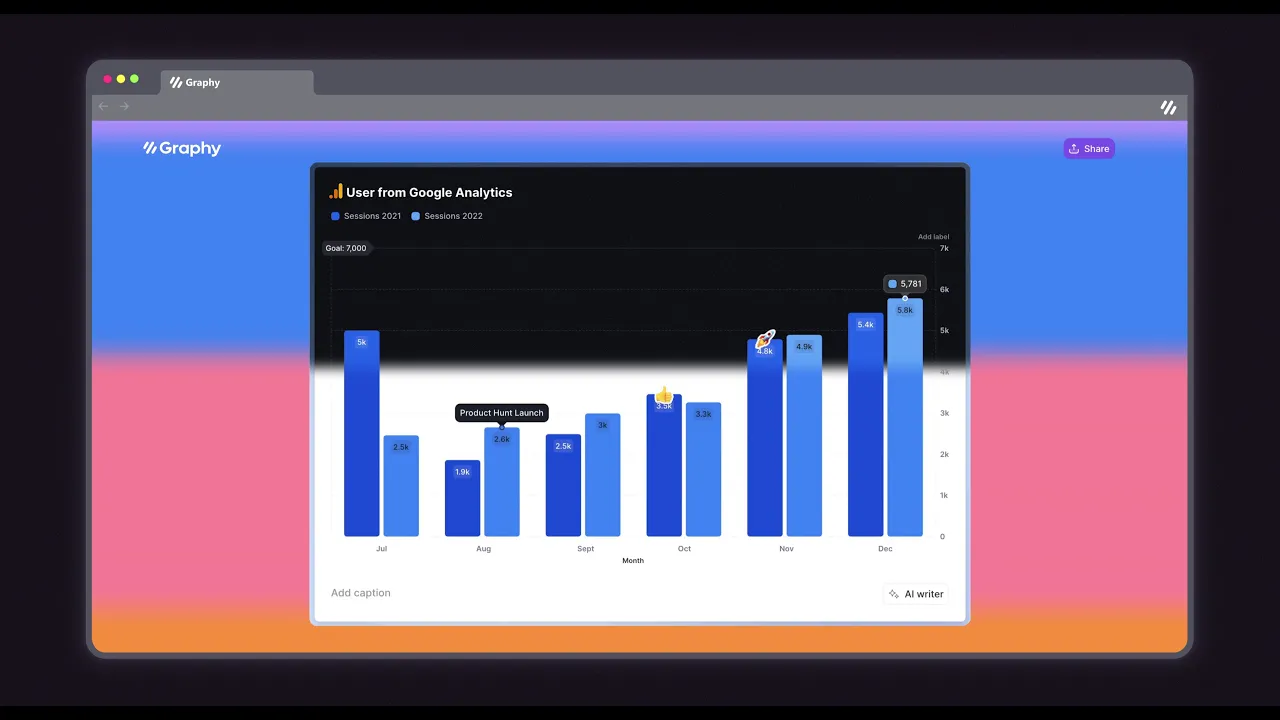
Graphy is a totally new way to take your data from wherever it lives and bring it into a single place. Quickly. Effortlessly. Up to date.
All you wanted was a few numbers, visualized.
Instead, you spent a ton of money and ended up with outdated charts, dashboards you can’t access, endless spreadsheets floating around, ”just learn SQL”, and that weekly email from Greg (sorry Greg, we know you’re trying!)
And let’s be honest, it’s not working.
You spend your time running from meeting to meeting with 50 browser tabs open, rifling through blurry screenshots of dashboards and dreaming of when the analytics team will finally integrate that tool you use.
Oh and don’t even start with the reporting. Who even reads those anyway?
How are you supposed to turn your business into a rocketship if you can’t even get on the same page about where you are today and where you’re aiming to get tomorrow?
There has to be a better way.
That’s why we built Graphy.
Graphy is a totally new way to take your data from wherever it lives and bring it into a single place. Quickly. Effortlessly. Up to date.
Imagine a single view of all your data. Everyone aligned on what you’ve achieved. Everyone knowing what you need to do next.
Graphy is easy to setup and use. We promise:
Imagine a single view of all your data. Everyone aligned on what you’ve achieved. Everyone knowing what you need to do next.
Graphy is easy to setup and use. We promise:
Imagine a single view of all your data. Everyone aligned on what you’ve achieved. Everyone knowing what you need to do next.
Graphy is easy to setup and use. We promise:
No
No
No
cumbersome
cumbersome
integrations
integrations
No
No
No
messing
messing
around
around
with
with
OAuth
OAuth
No
No
No
data scientists needed
data scientists needed
No
No
No
sacrifices
sacrifices
to
to
the
the
god
god
of
of
databases
databases
It’s just a chrome extension, beautiful graphs and a little magic.
We believe it’s time to get your data working for you, not the other way around.
It’s just a chrome extension, beautiful graphs and a little magic.
We believe it’s time to get your data working for you, not the other way around.
It’s just a chrome extension, beautiful graphs and a little magic.
We believe it’s time to get your data working for you, not the other way around.
We’re launching to everyone later this year, but have 100 slots for early beta testers.
We’re launching to everyone later this year, but have 100 slots for early beta testers.
We’re launching to everyone later this year, but have 100 slots for early beta testers.