Graphy enables anyone to become a skilled data storyteller, by radically simplifying the way data is presented and communicated.
No credit card. Just beautiful graphs.


Made for modern teams
Graphy is purpose-built to make it simple yet delightful for you to drive decisions with your data.

Lightning fast

Remarkably easy to use
No learning curve, simple and intuitive interface packed with powerful features.

Beautiful results
Create stunning, interactive graphs you’ll be proud to share.


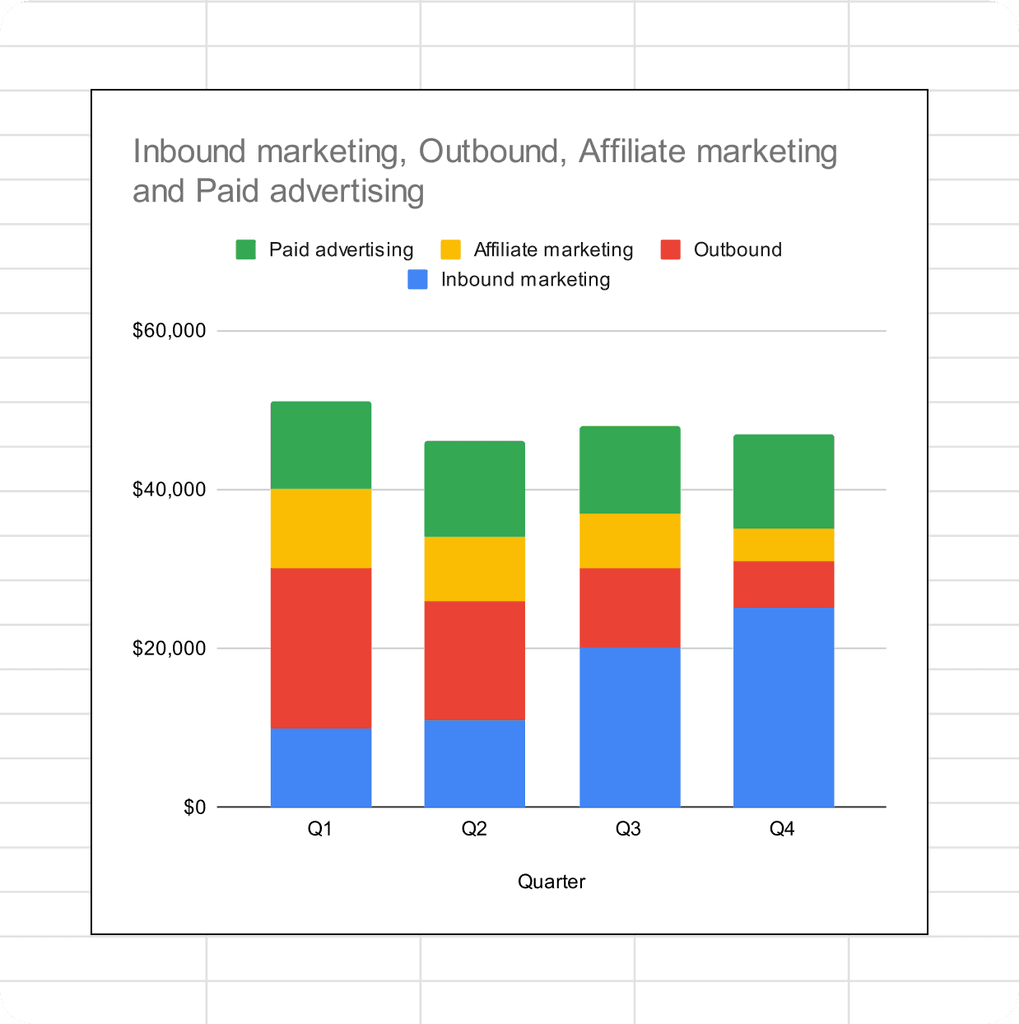
Make data meaningful with rich storytelling
Communicate insights and focus attention on key data points with visual annotations and one click enhancements such as goals and trend lines.
Connect Google Sheets


Paste data from anywhere

AI generated insights


AI generated graphs


API

Light / Dark mode


Built to be shared where your work happens.
Collaborate and make decisions together in Graphy, or share graphs where the work is happening as embeds, interactive links, or images.

Wall of love

Cindy Ibanez
Global Head of Marketing at
Wynwood House
Thanks to Graphy 5 days of reporting were done in 4 hours. My team were in love! They were like, oh my God, what is this, this is the future!

Ryan Hoover
Founder of Product Hunt
I’d rather eat cardboard than create another pivot table Thanks, Graphy (I don’t like cardboard)

Nick Lafferty
Founder at Early Exit Club
Graphy is the first tool I use when I'm looking to quickly create stunning visuals for my newsletter, social feeds, and my consulting business. I'm not stuck using Google Sheet's terrible default graphs anymore!

Guillermo Rauch
CEO at Vercel
Stunning product.

Joe Edwards
Senior Growth Marketing
Manager at Venafi
Most other data tools are passive and leave it up to the stakeholders to interpret the numbers.
Graphy helps you create stunning charts from disparate sources with the context and commentary your stakeholders need.

Liam Shalon
Director of Research and
Development at Level Ventures
Most of the BI/internal tools we have for generating reports suck so bad that it’s embarrassing. Graphy is one of the few tools in the space for visualizing data that ‘just works’.

Jakob Knutzen
CEO & Co-Founder at Butter
Graphy allows me to make beautiful, super customized charts. This makes my communications of numbers to both investors and team much clearer. Plus it's just fun to use 😊

Stan Massueras
General Manager at Lattice
Great ideas are only impactful when communicated clearly.
Graphy enabled us to transform data into compelling stories, and those stories into meaningful action.

Mitchell Croft
Finance Director at
Made Thought
Switched from presenting boring excel tables to using Graphy

Tim Chong
Co-founder and CEO at Yonder
Graphy has been game changing in helping our team build beautiful graphs without the hassle of formatting in Excel. We use it for our internal reporting and board memos, it's super easy to make graphs in seconds.

Felix Kuhlmann
Analyst at Antler
Graphy helps me to make sense of our data from multiple sources in one place.