


Share updates with your team
and investors that tell a compelling story
and investors that tell a
compelling story

The easiest way to create a visually clear narrative around charts.
Add your data, mark it up, share it out, refresh, and repeat.
No credit card required


Plain emails don't tell your company's story
Company updates can give your team focus and make your investors helpful, but current tools make it slow and difficult to control the narrative and data.
Making charts that look how you want takes too much time
Making charts that look how you want takes too much time
Making charts that look how you want takes too much time
Boring emails don't get the engagement they deserve
Boring emails don't get the engagement they deserve
Boring emails don't get the engagement they deserve
The data from in-app analytics and BI tools is too heavy
The data from in-app analytics and BI tools is too heavy
The data from in-app analytics and BI tools is too heavy
Once the data is in one place, the narrative is often forgotten
Once the data is in one place, the narrative is often forgotten
Once the data is in one place, the narrative is often forgotten

Key features for better company updates
Watch the 2 minute demo video on how to create updates that have a clear narrative with Graphy.
1.
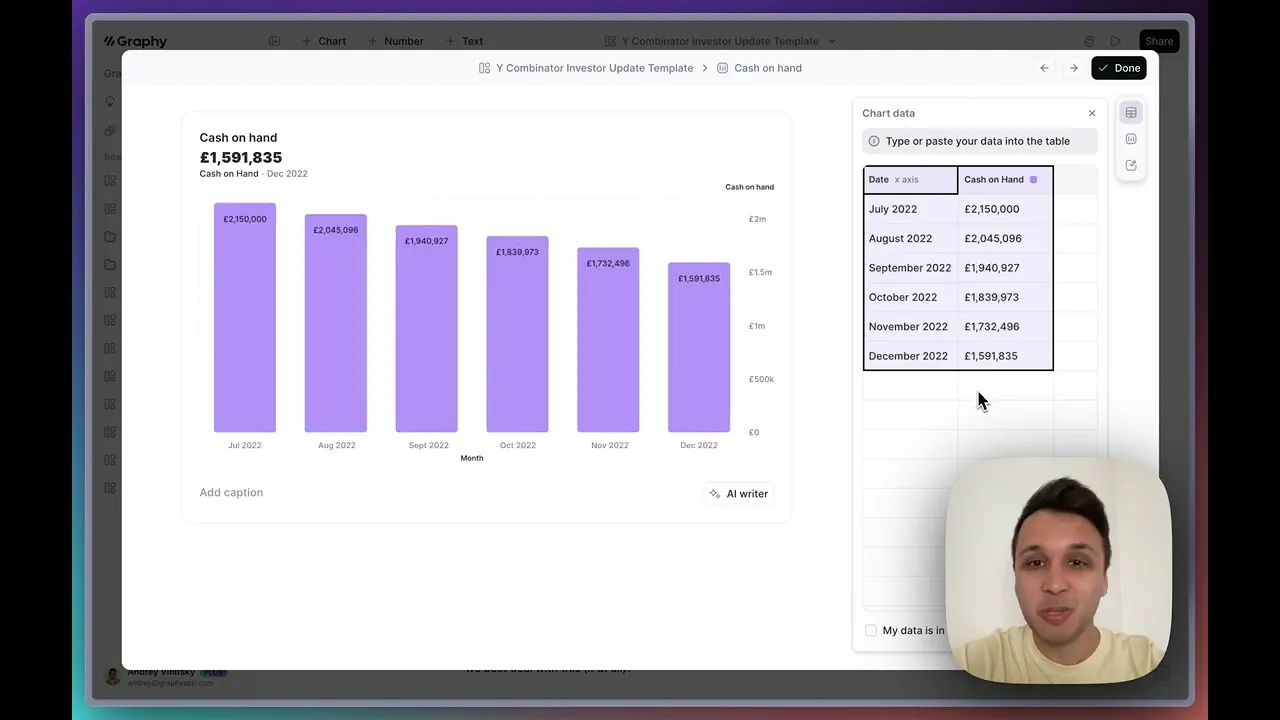
Add the data on your business' key metrics
2.
Quickly customize, annotate and add narrative
3.
Share in an email or link for interactivity
Key features for better company updates
Watch the 2 minute demo video on how to create updates that have a clear narrative with Graphy.
1.
Add the data on your business' key metrics
2.
Quickly customize, annotate and add narrative
3.
Share in an email or link for interactivity
Key features for better company updates
Watch the 2 minute demo video on how to create updates that have a clear narrative with Graphy.
1.
Add the data on your business' key metrics
2.
Quickly customize, annotate and add narrative
3.
Share in an email or link for interactivity

Key features for better company updates
Watch the 2 minute demo video on how to create updates that have a clear narrative with Graphy.
1.
Add the data on your business' key metrics
2.
Quickly customize, annotate and add narrative
3.
Share in an email or link for interactivity
Paste in your data or pull metrics together from


As simple as taking a screenshot. As easy as one click to update.
As simple as taking a screenshot.
As easy as one click to update.
What Founders say about us

Jakob Knutzen
Co-founder & CEO
Butter
Graphy allows me to make beautiful, super customized charts. This makes my communications of numbers to both investors and team much clearer. Plus it's just fun to use 😊

Tim Chong
Co-founder & CEO
Yonder
Graphy has been game changing in helping our team build beautiful graphs without the hassle of formatting in Excel. We use it for our internal reporting and board memos, it’s super easy to make graphs in seconds.
Jakob Knutzen
Co-founder & CEO
Butter
Graphy allows me to make beautiful, super customized charts. This makes my communications of numbers to both investors and team much clearer. Plus it's just fun to use 😊
Tim Chong
Co-founder & CEO
Yonder
Graphy has been game changing in helping our team build beautiful graphs without the hassle of formatting in Excel. We use it for our internal reporting and board memos, it’s super easy to make graphs in seconds.
★ 4.6
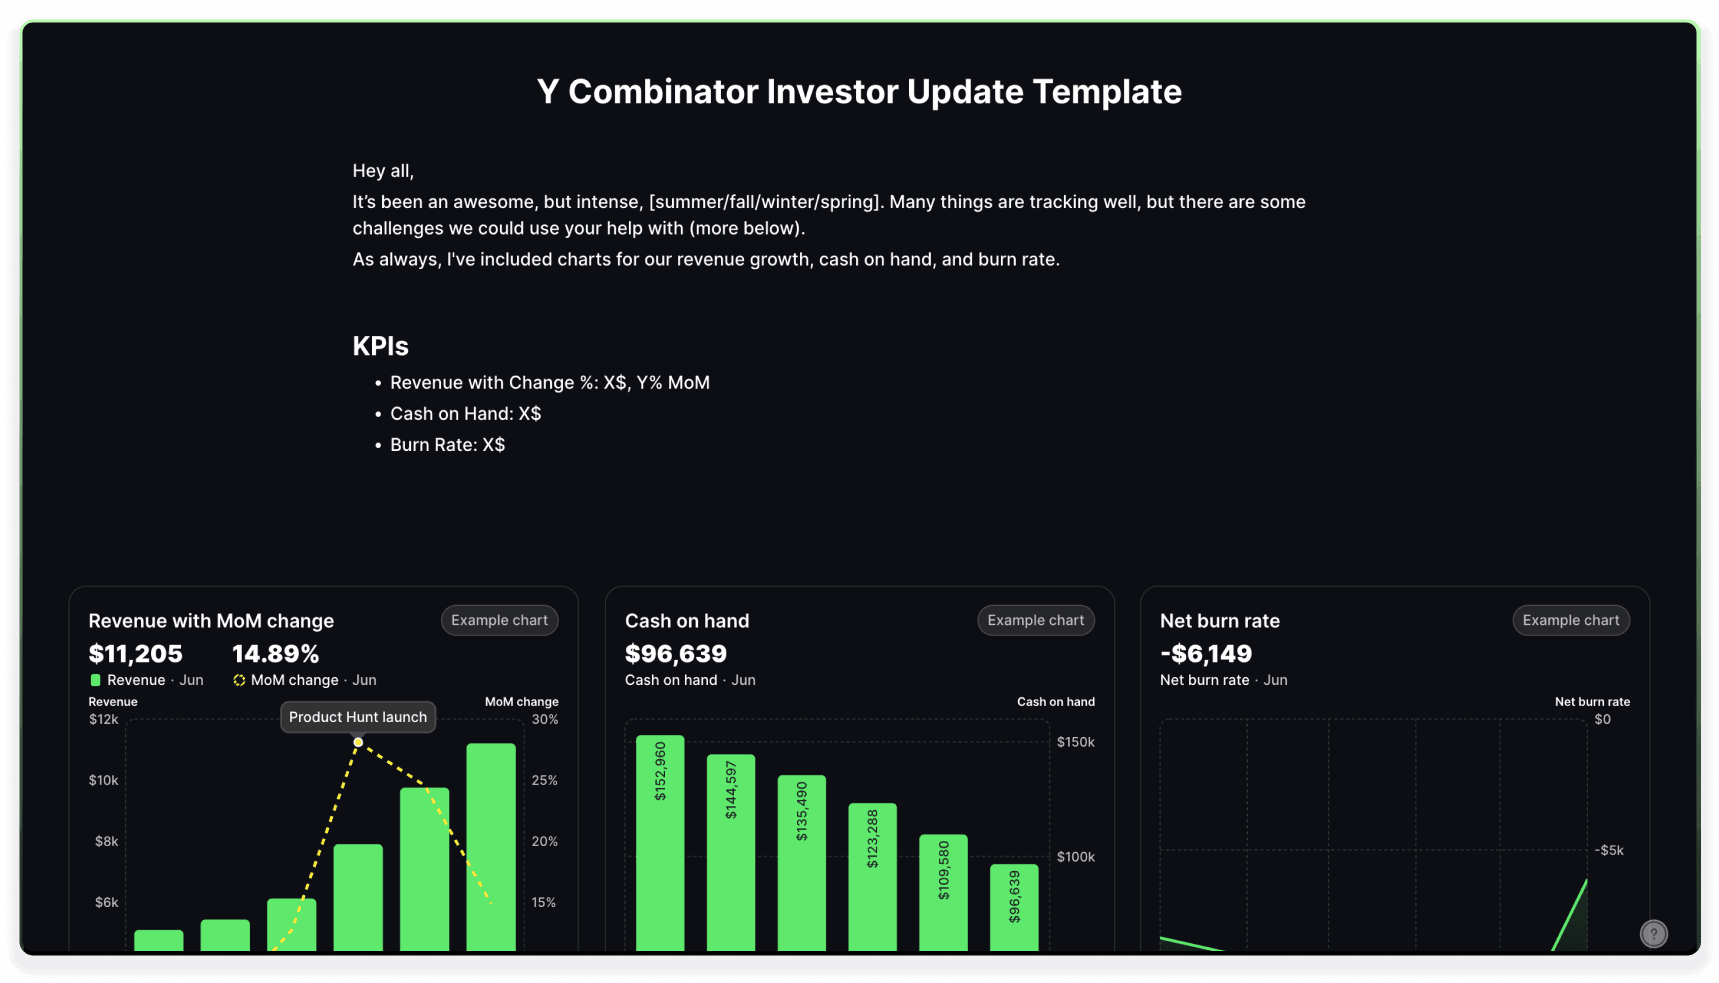
Made with Graphy


Create your first Board
Unlimited graphs, unlimited data, unlimited viewers. All for free. What are you waiting for?
Graphy
Graphy enables anyone to become a skilled data storyteller, by radically simplifying the way data is presented and communicated.
Graphy Technologies Ltd. 2025. All rights reserved
Graphy
Graphy enables anyone to become a skilled data storyteller, by radically simplifying the way data is presented and communicated.
Graphy Technologies Ltd. 2025. All rights reserved
Graphy
Graphy enables anyone to become a skilled data storyteller, by radically simplifying the way data is presented and communicated.
Graphy Technologies Ltd. 2025. All rights reserved