


in one report, in one click.
All of your
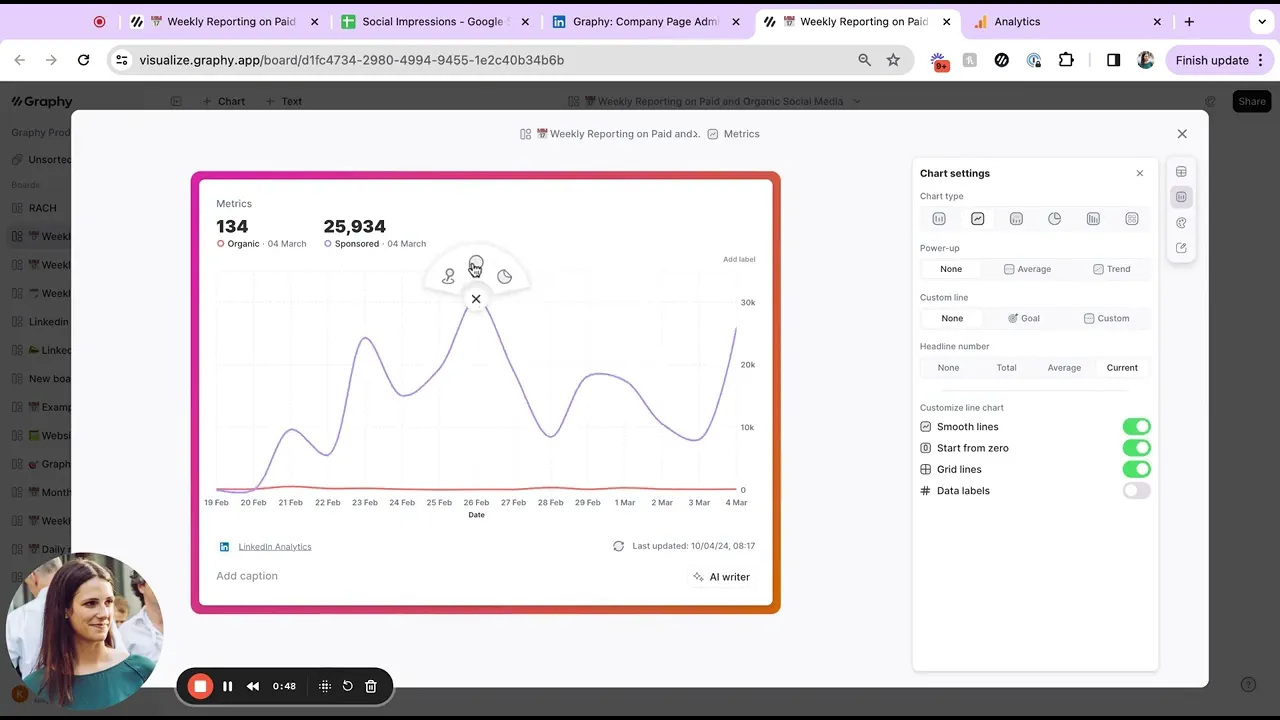
social media data
The easiest way to bring all your paid and organic social media
data into one place so you can tell a clearer story to your team.
No credit card. Just beautiful graphs and boards
Social media reporting is a painful process
The impact of a marketer's work is partially measured by their team's understanding of it, but current tools make it slow and difficult to tell a clear story.
Pull metrics together from...


What Marketers say about us

Cindy Ibanez
Head of Marketing at
Wynwood House
Thanks to Graphy 5 days of reporting were done in 4 hours. My team were in love! They were like, oh my God, what is this, this is the future!

★ 4.5


