
Craft beautiful
ready-to-share graphs that inspire action.


Invest minutes, save hours, and turn data into actionable decisions.
No credit card. Just beautiful graphs and boards


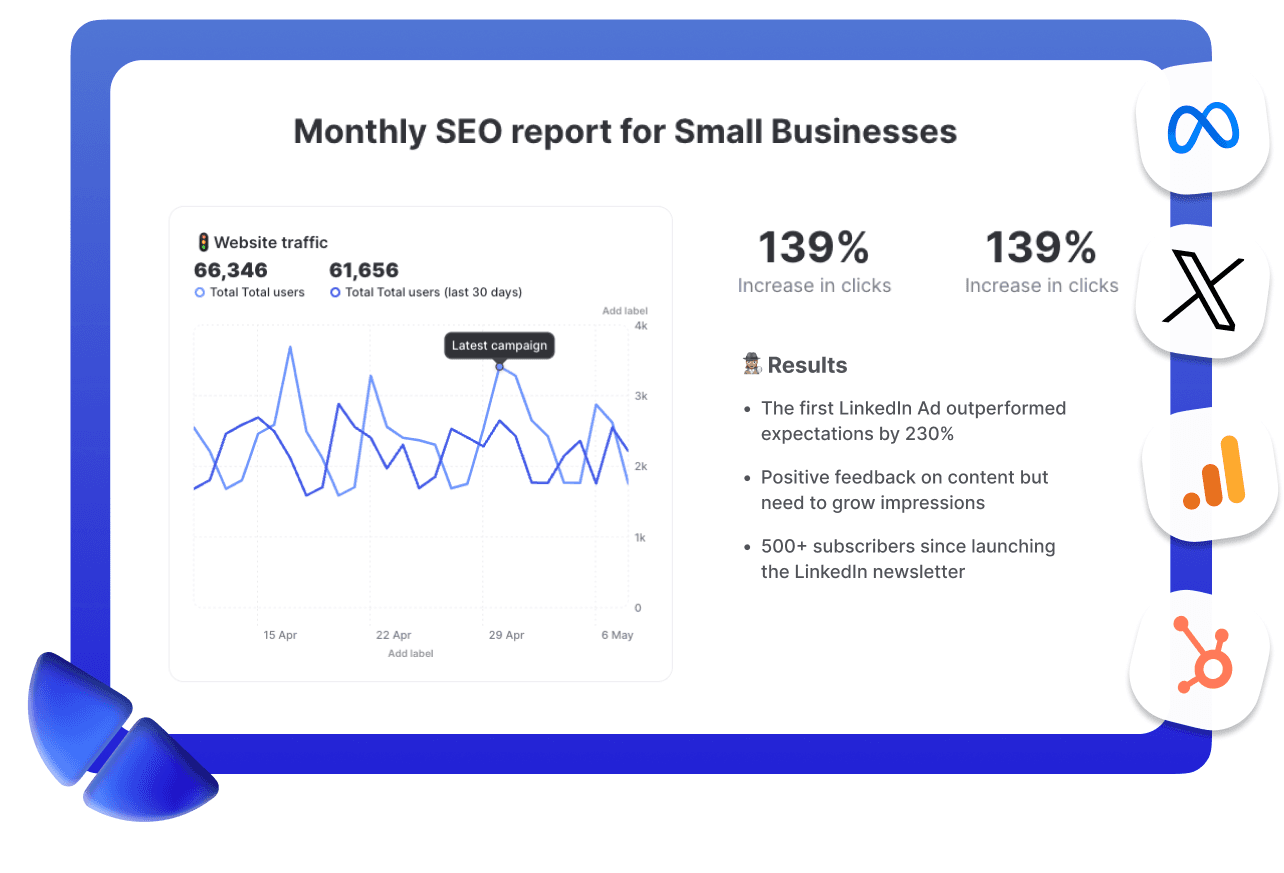
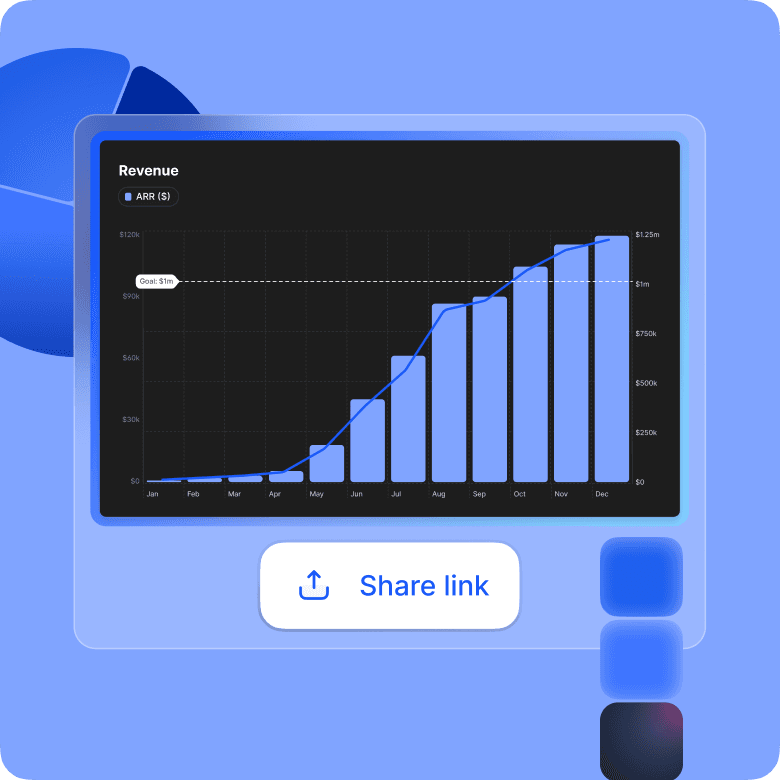
Ditch the screenshots and create a uniform look for your data.
Choose from stunning presets or bring your full brand to life.
Grab attention with text and numerical callouts.


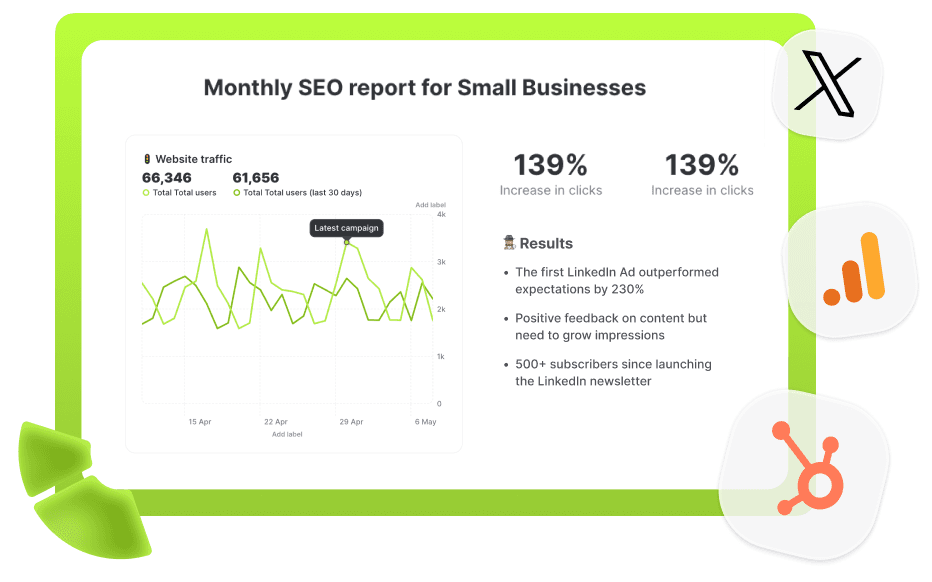
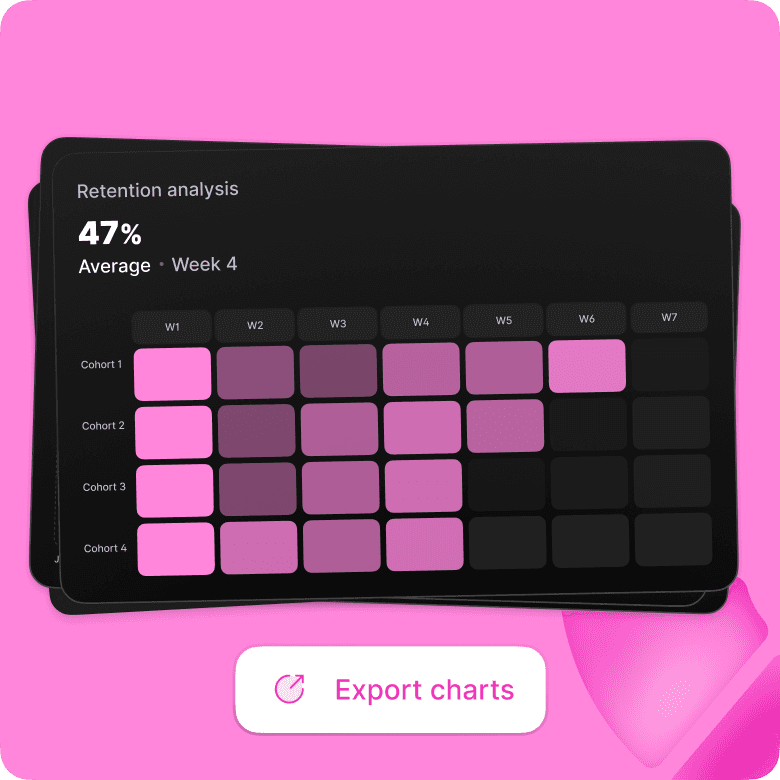
Ditch the screenshots and create a uniform look for your data.
Choose from chic presets or bring your full brand to life.
Grab attention with text and numerical callouts.

Wall of love

Cindy Ibanez
Thanks to Graphy 5 days of reporting were done in 4 hours. My team were in love! They were like, oh my God, what is this, this is the future!

Ryan Hoover
@rrhoover
I’d rather eat cardboard than create another pivot table Thanks, Graphy (I don’t like cardboard)
Lauren
@waller_texas
NOT DONE
NOT DONE
NOT DONE
Joe
@DannPetty
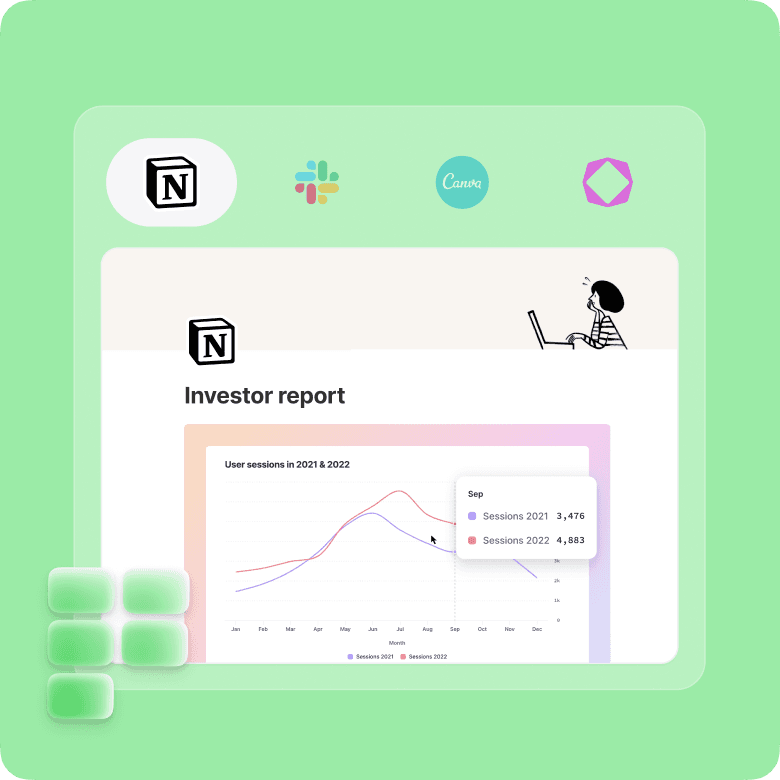
Most other data tools are passive and leave it up to the stakeholders to interpret the numbers.
Graphy helps you create stunning charts from disparate sources with the context and commentary your stakeholders need.
Liam
@pixelbeat
Most of the BI/internal tools we have for generating reports suck so bad that it’s embarrassing. Graphy is one of the few tools in the space for visualizing data that ‘just works’.
Parker
@_prkr
NOT DONE
NOT DONE
NOT DONE
NOT DONE

Great ideas are only impactful when communicated clearly.
Graphy enabled us to transform data into compelling stories, and those stories into meaningful action.

Guillermo Rauch
@rauchg
Stunning product.
Mitch
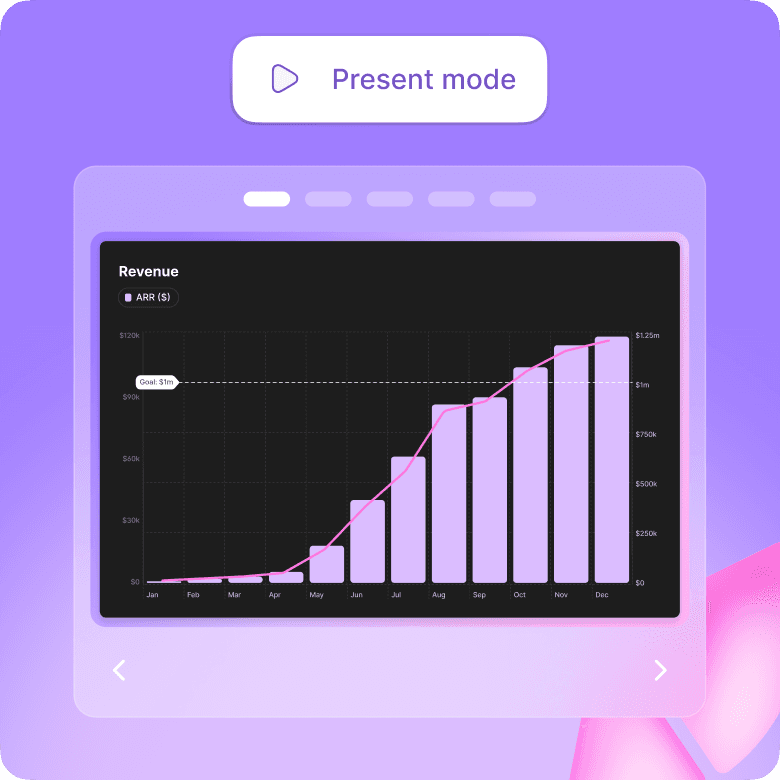
Switched from presenting boring excel tables to using Graphy
Create your first Board
Unlimited graphs, unlimited data, unlimited viewers. All for free. What are you waiting for?


Save to Graphy

Cindy Ibanez
Head of Marketing at
Wynwood House
