ANNOUNCING
ANNOUNCING
GRAPHY AI
GRAPHY AI
The AI Graph Maker
From messy data to beautiful graphs in a click.
Graphy is the fastest way to tell stories with data.
From messy data to beautiful graphs in a click. Graphy is the fastest way to tell stories with data.


Benefits of data storytelling
Actionable insights
No ambiguity
Fewer meetings
Faster decisions
Less back & forth
Stronger alignment
Shared understanding
Actionable insights
No ambiguity
Fewer meetings
Faster decisions
Less back & forth
Actionable insights
Actionable insights


How it works
How it works
How it works
1
Add your data
Link a live Google Sheet, upload a CSV or Excel file, paste or type values, call our API, or ask AI to search for data.
No need to prepare or format, Graphy ingests it all.
1
1
Add your data
Add your data
Link a live Google Sheet, upload a CSV or Excel file, paste or type values, call our API, or ask AI to search for data.
No need to prepare or format, Graphy ingests it all.
2
Let AI work its magic
Let AI work its magic
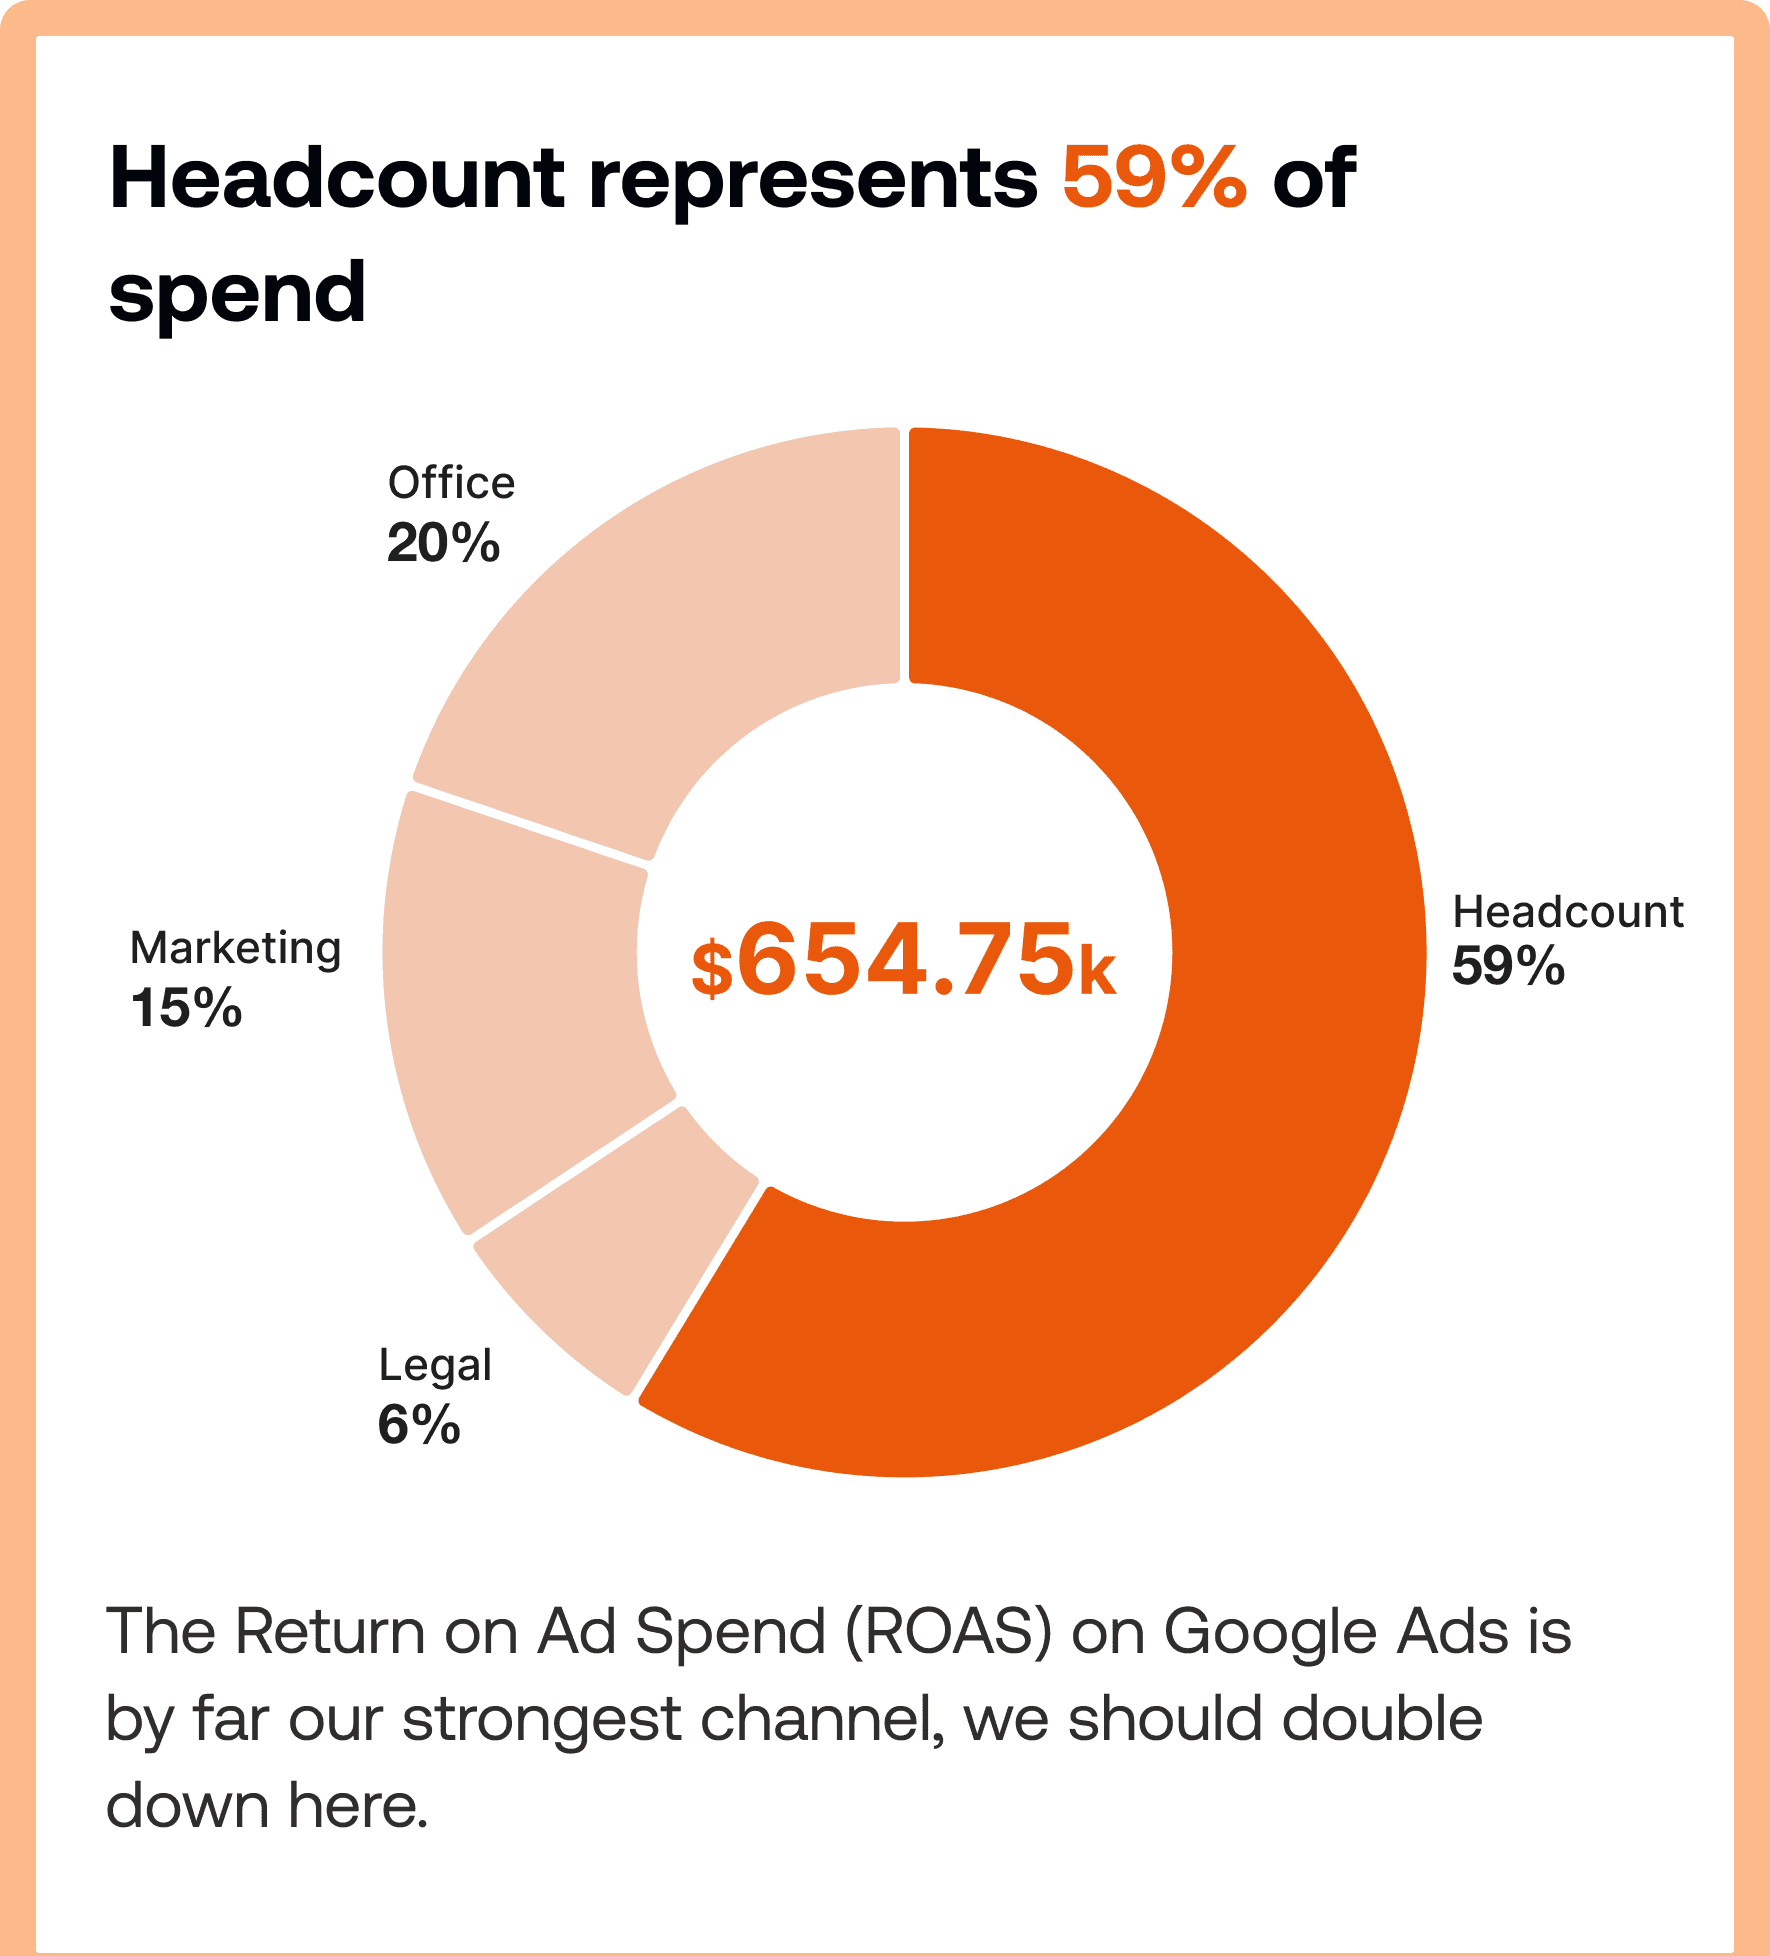
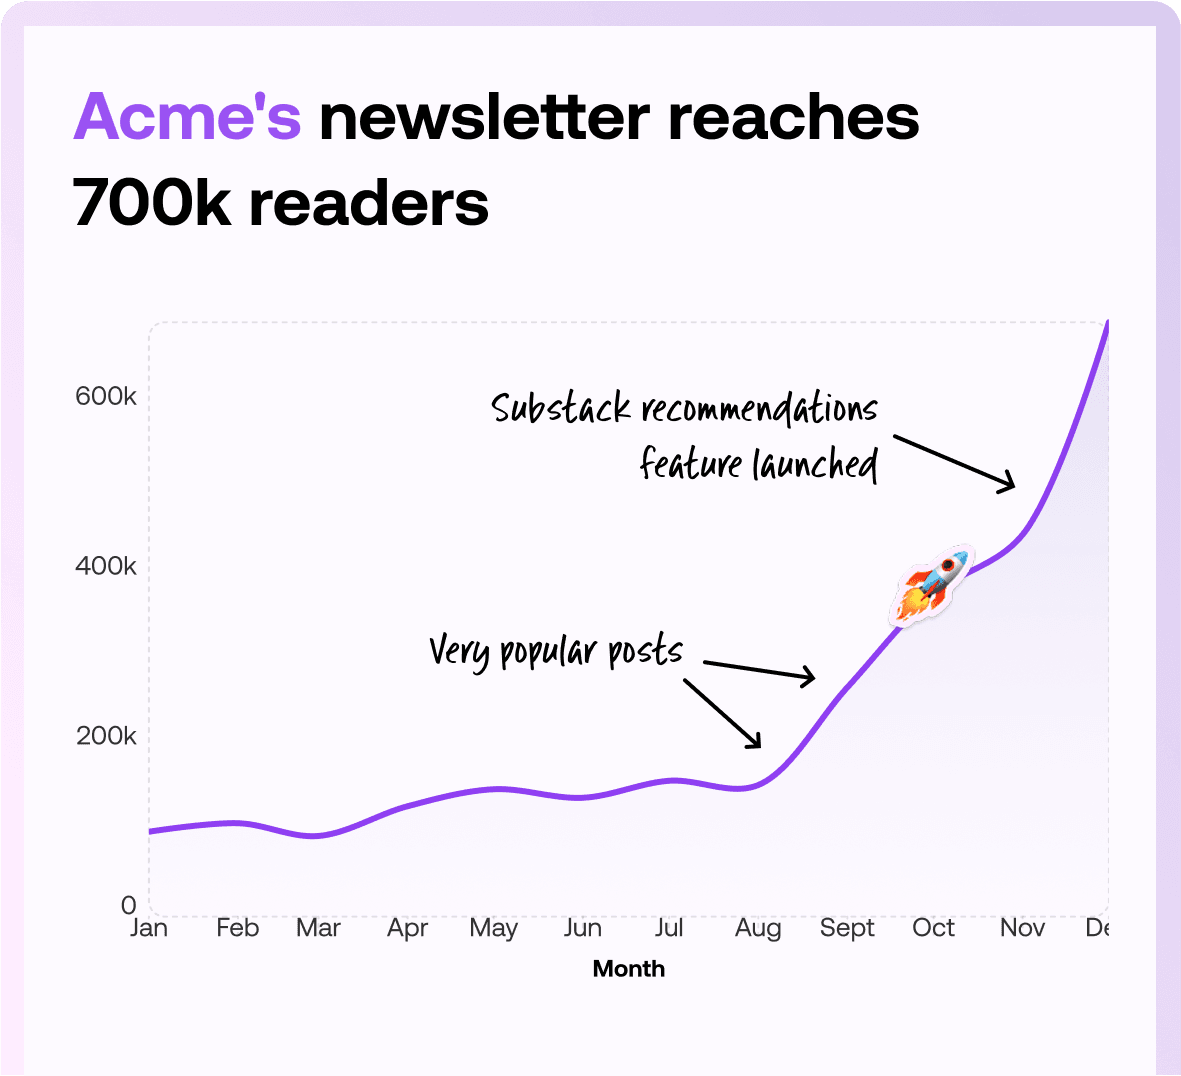
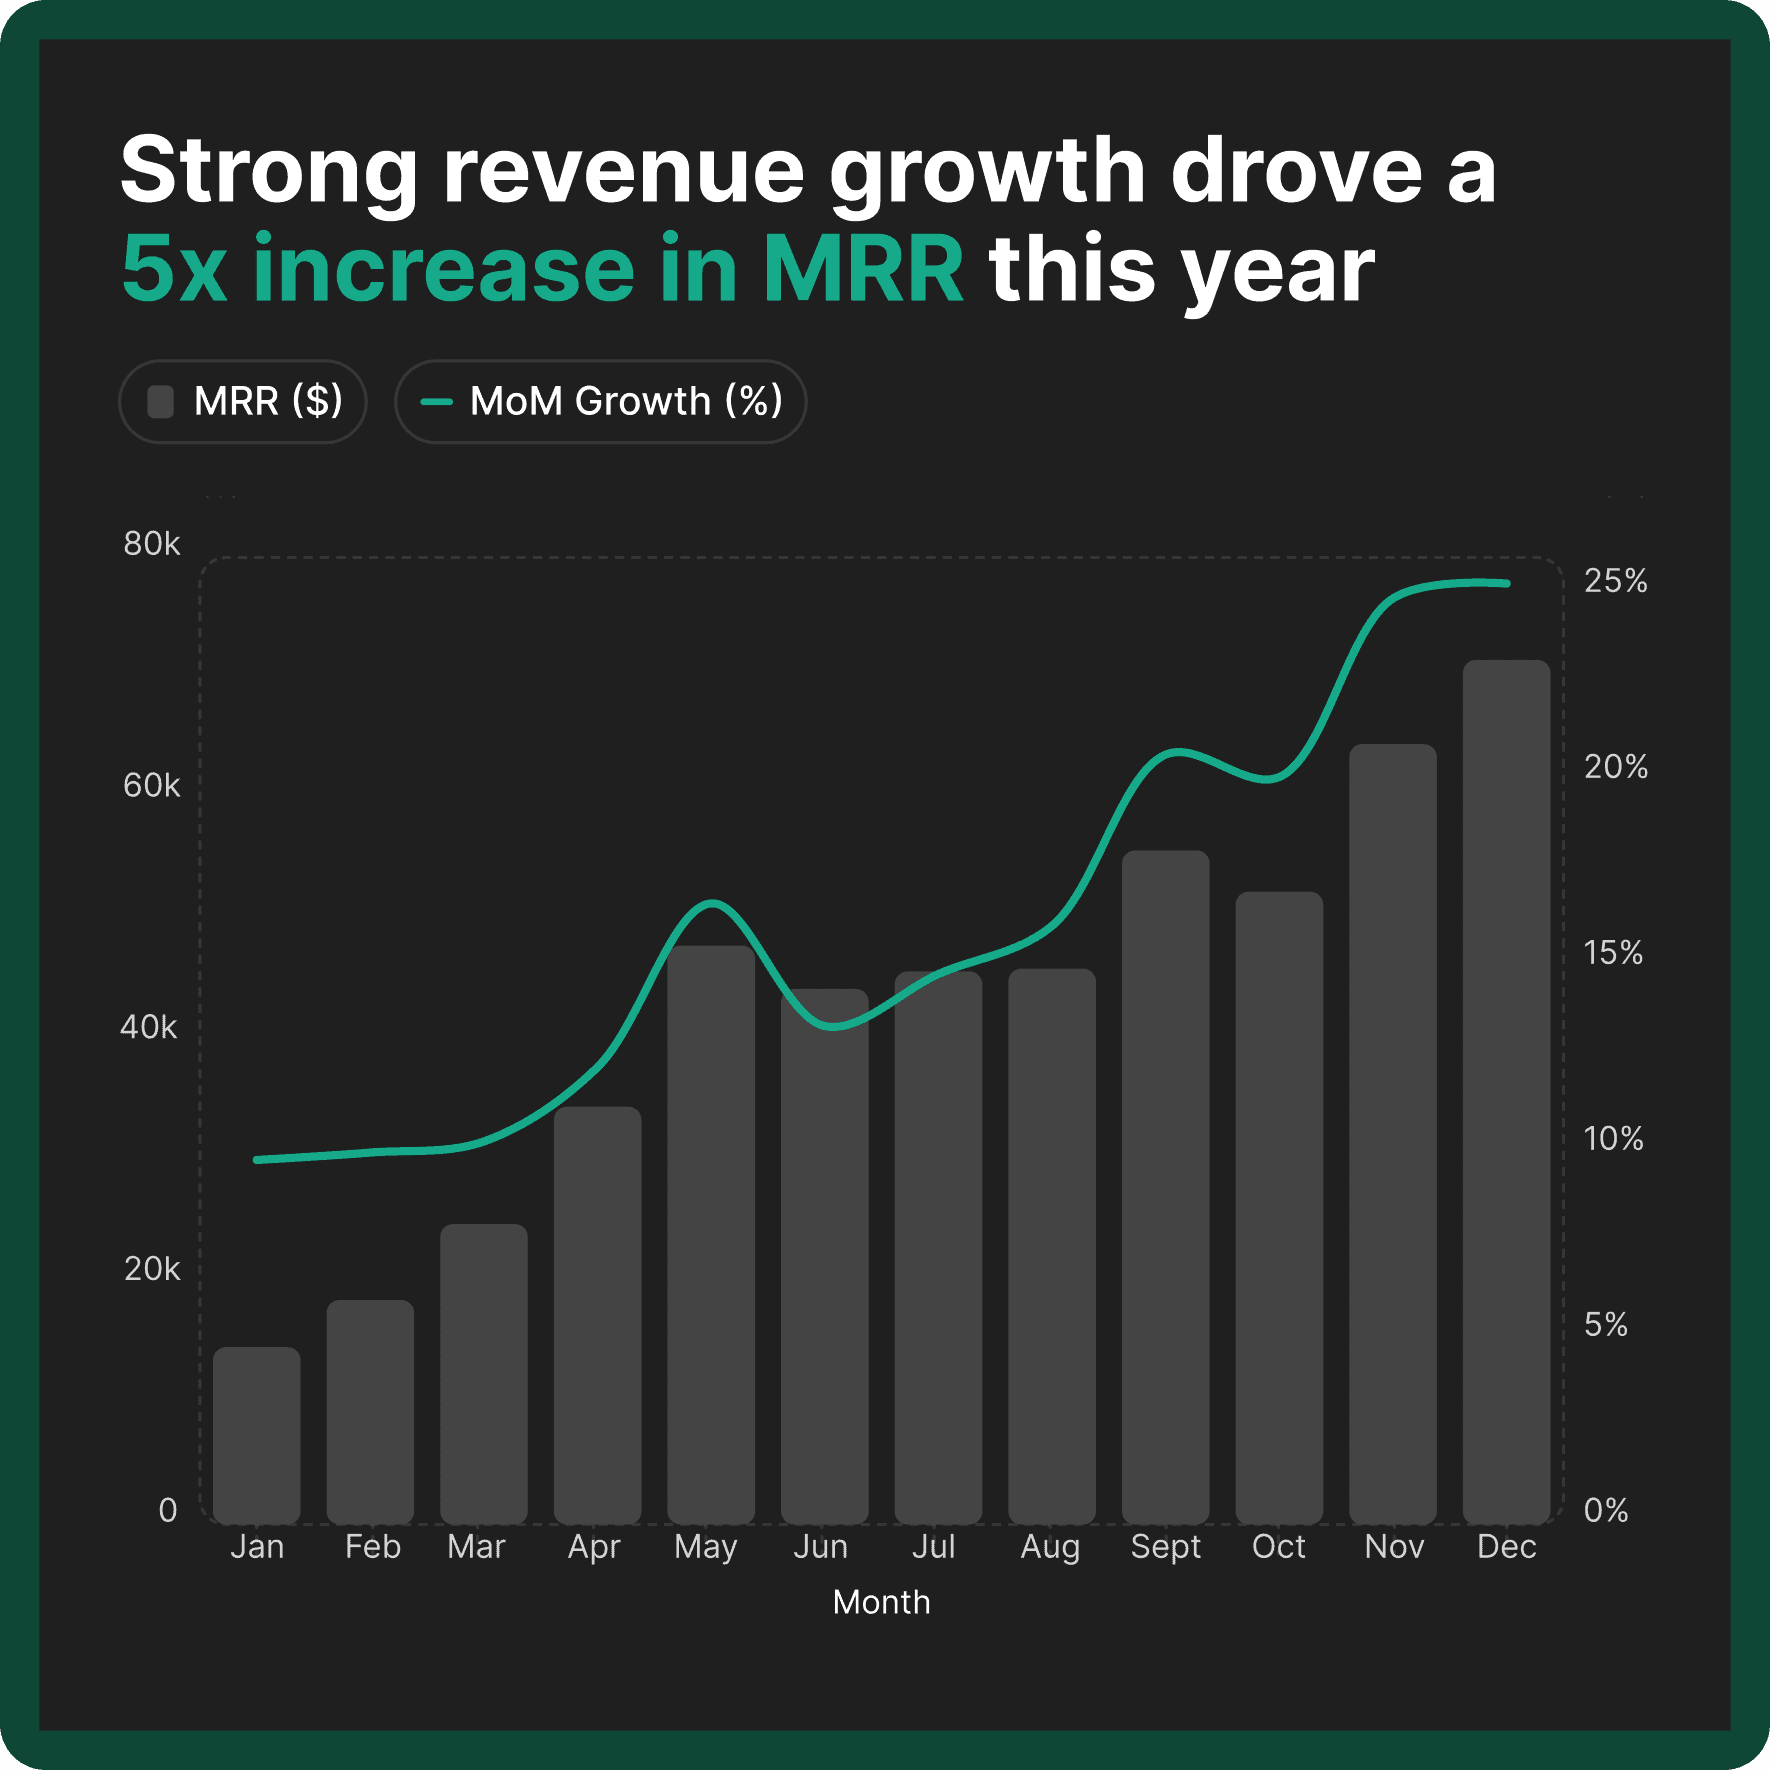
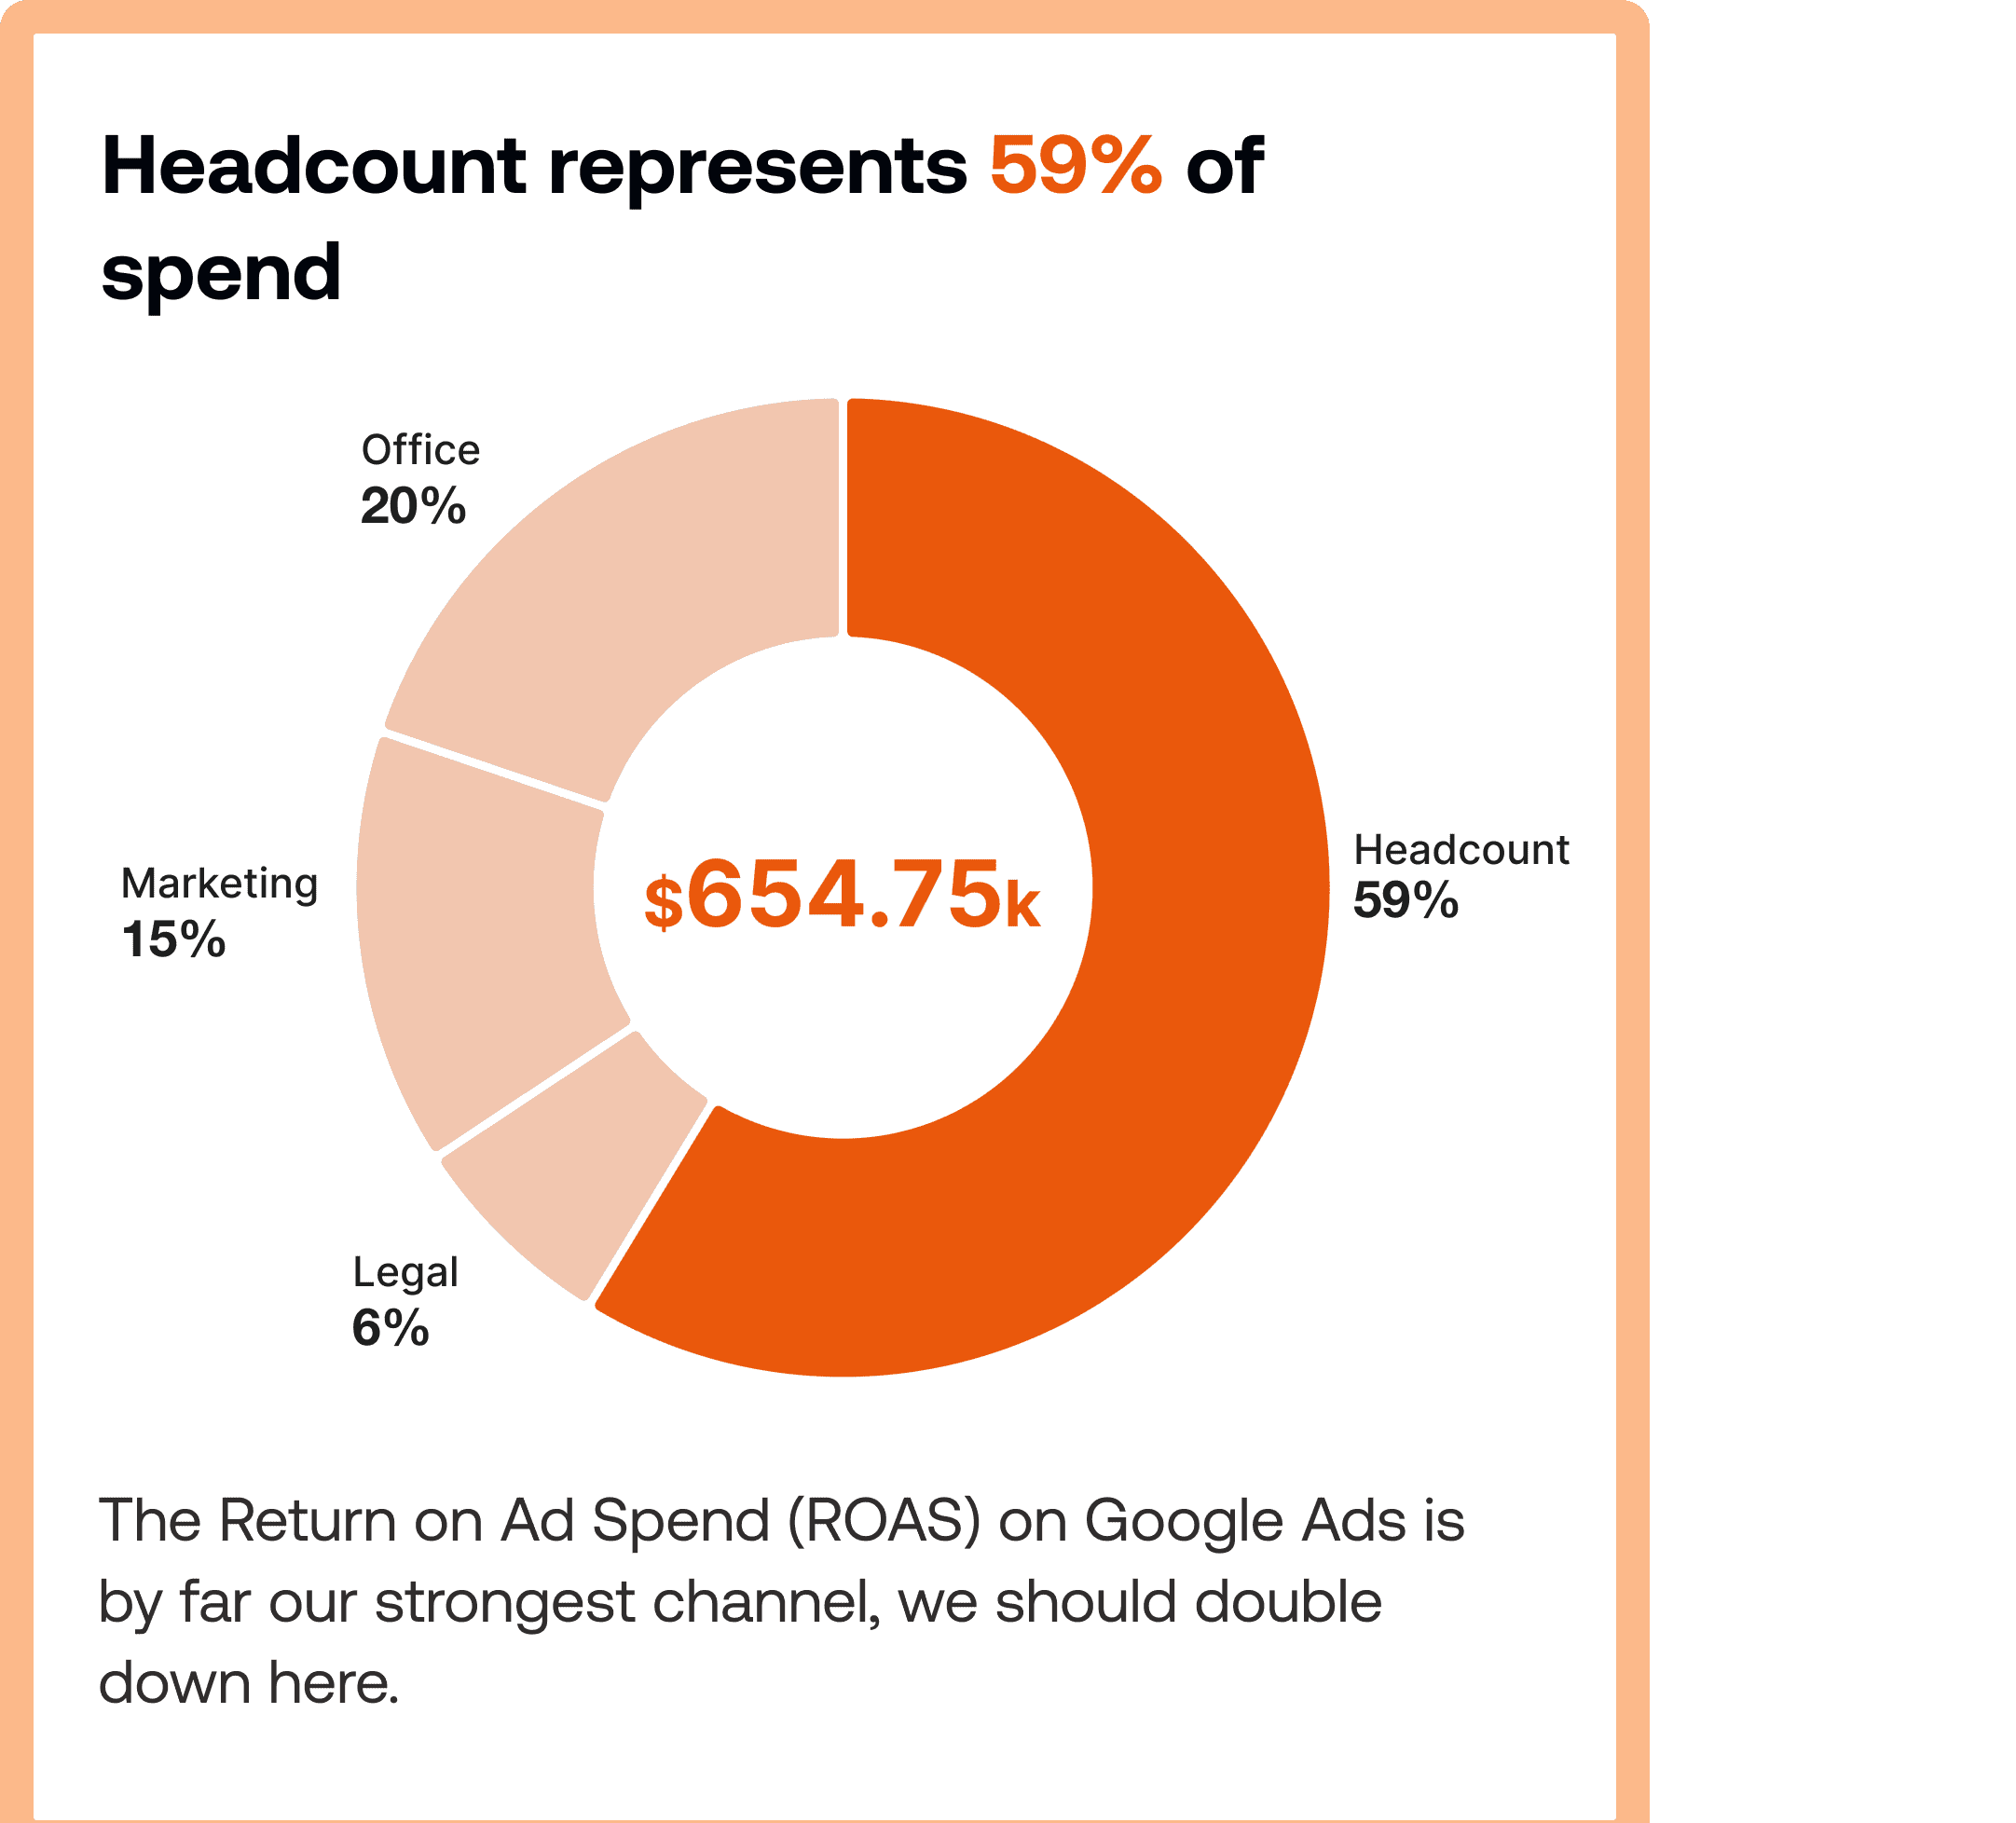
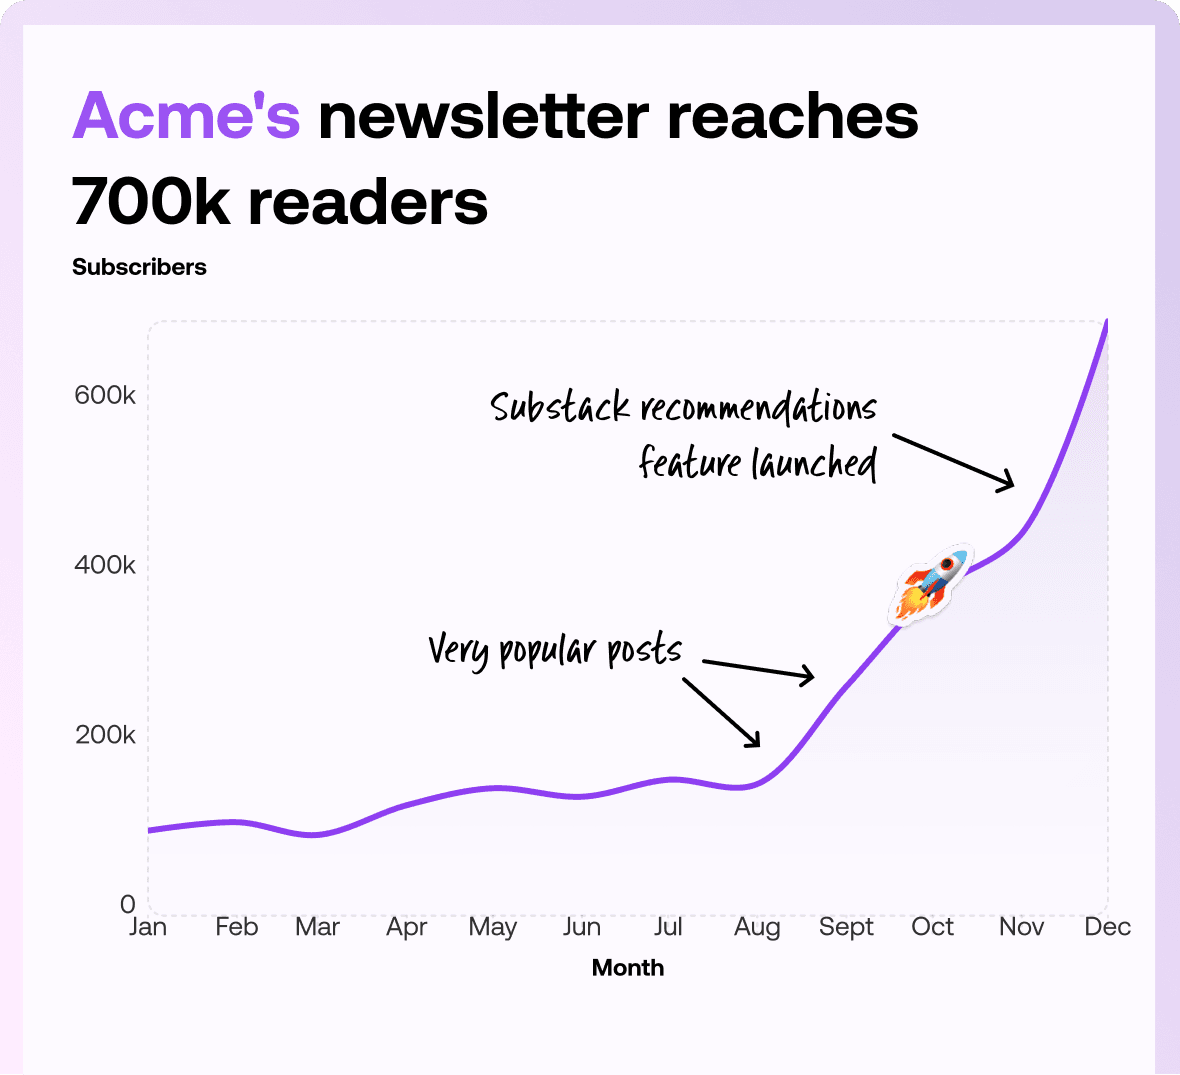
Our AI inspects every row and spits out the three clearest charts — complete with headline take-aways.
Our data engine reads through your dataset and highlights the insights that matter most. You’ll always see how it got there, so you can trust every step.
Our data engine reads through your dataset and highlights the insights that matter most. You’ll always see how it got there, so you can trust every step.
We'll build you the best chart, but if you want something else? Just ask!
2
Let AI work its magic
Our data engine reads through your dataset and highlights the insights that matter most. You’ll always see how it got there, so you can trust every step.
We’ll suggest the best chart for your data — but if you’d prefer something else, just ask!
1
3
Let your data shine
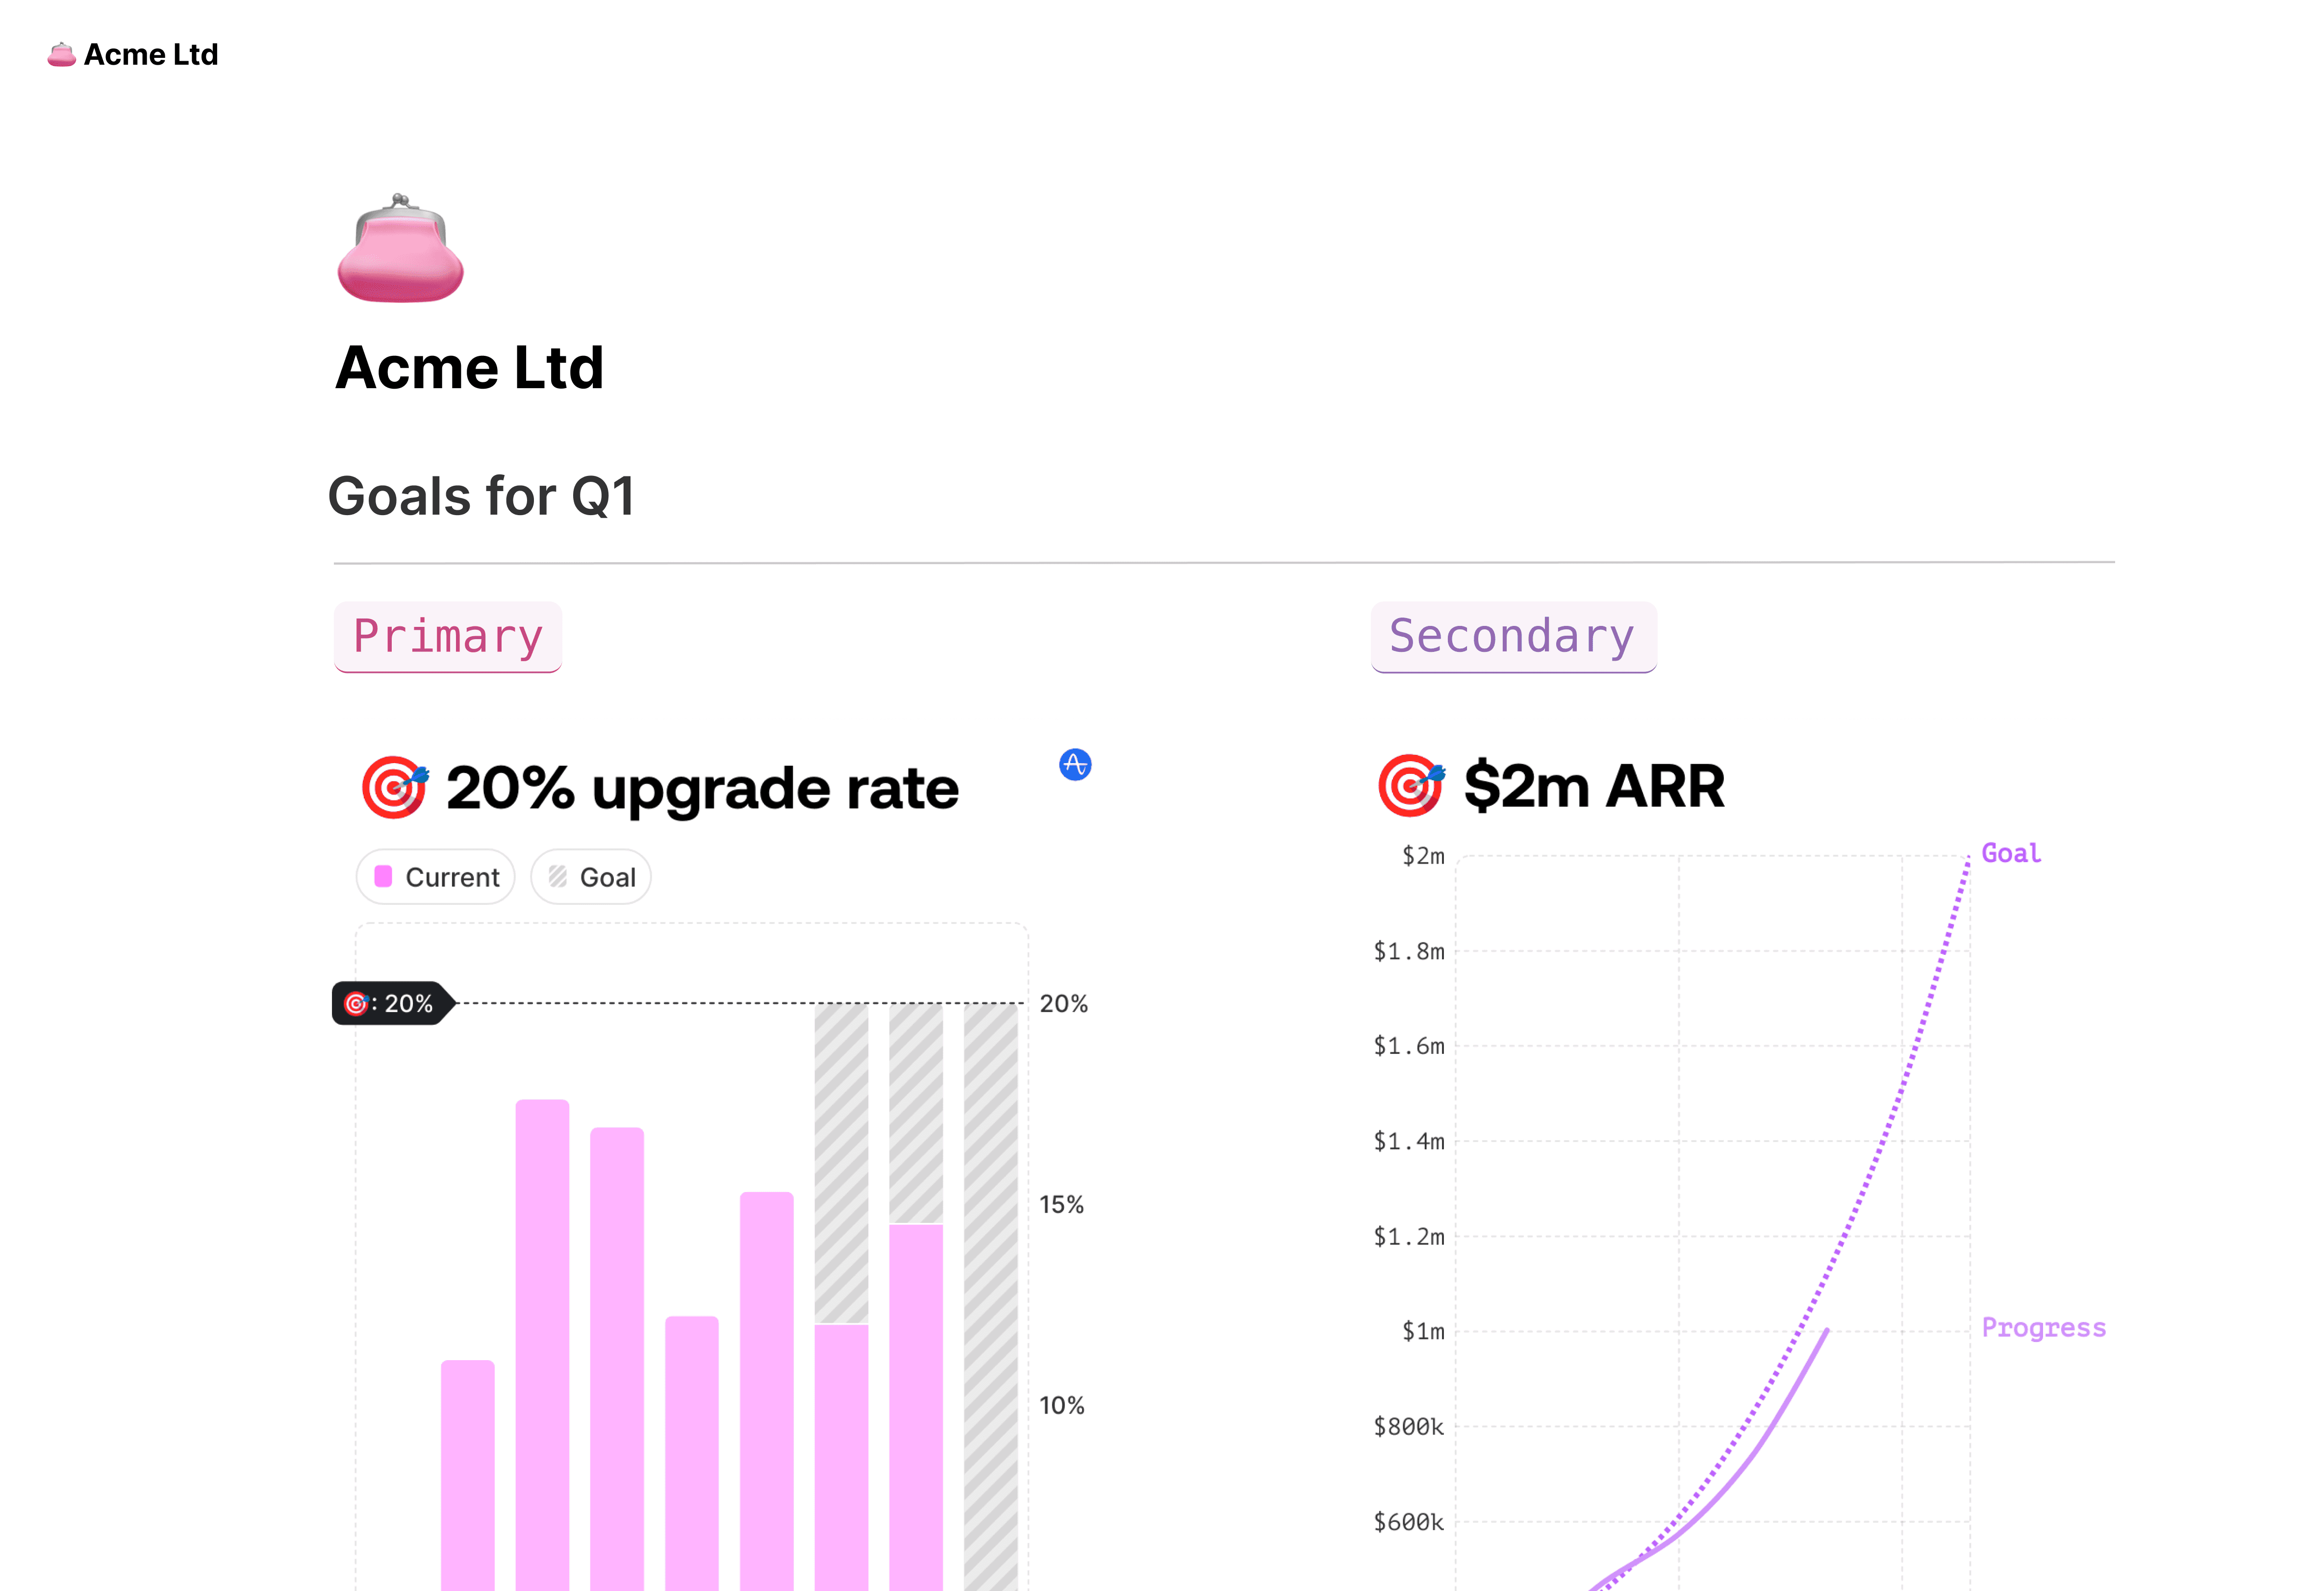
Instantly brand all your charts with your colors, fonts, and style.
1
4
Tell your story
Export or embed — your call
Slides that speak
When you need your data to do the talking

Social posts that perform


Share insights that actually get seen

Docs with direction
Clarity for teams, right where they work
1
3
Let your data shine
Let your data shine
Apply your brand to all charts
Instantly brand all your charts with your colors, fonts, and style.
Instantly brand all your charts with your colors, fonts, and style.
4
Tell your story
Export or embed — your call
Slides that speak
When you need your data to do the talking
When you need your data to do the talking
Social posts that perform
Share insights that actually get seen
Share insights that actually get seen
Docs with direction
Clarity for teams, right where they work
Clarity for teams, right where they work
Wall of love

Cindy Ibanez
Global Head of Marketing at Wynwood House
Thanks to Graphy 5 days of reporting were done in 4 hours.
My team were in love! They were like, oh my God, what is this, this is the future!

Joe Edwards
Senior Growth Marketing Manager at Venafi
Most other data tools are passive and leave it up to the stakeholders to interpret the numbers
Graphy helps you create stunning charts from disparate sources with the context and commentary your stakeholders need.

Stan Massueras
General Manager at Lattice
Great ideas are only impactful when communicated clearly.
Graphy enabled us to transform data into compelling stories, and those stories into meaningful action.

Ryan Hoover
Founder of Product Hunt
I’d rather eat cardboard than create another pivot table Thanks, Graphy (I don’t like cardboard)

Nick Lafferty
Founder at Early Exit Club
Graphy is the first tool I use when I'm looking to quickly create stunning visuals for my newsletter, social feeds, and my consulting business. I'm not stuck using Google Sheet's terrible default graphs anymore!

Liam Shalon
Director of Research and
Development at Level Ventures
Most of the BI/internal tools we have for generating reports suck so bad that it’s embarrassing. Graphy is one of the few tools in the space for visualizing data that ‘just works’.

Michael Cockburn
Founder of Desana
It was a complete game changer when Graphy started to allow me to prompt it for insights, fine tune them, and make beautiful visualizations out the other side.
Feels like the future of storytelling in business.

Mitchell Croft
Finance Director at Made Thought
Switched from presenting boring excel tables to using Graphy

Tim Chong
Co-founder and CEO at Yonder
Graphy has been game changing in helping our team build beautiful graphs without the hassle of formatting in Excel.
We use it for our internal reporting and board memos, it's super easy to make graphs in seconds.

Felix Kuhlmann
Analyst at Antler
Graphy helps me to make sense of our data from multiple sources in one place.

Jakob Knutzen
CEO & Co-Founder at Butter
Graphy allows me to make beautiful, super customized charts. This makes my communications of numbers to both investors and team much clearer.
Plus it's just fun to use 😊

Guillermo Rauch
CEO at Vercel
Stunning product.
The AI Graph Maker
From messy data to beautiful graphs in a click,
Graphy is the fastest way to tell stories with data.

Graphs
All graphs
Graphy Technologies Ltd. 2025. All rights reserved
The AI Graph Maker
From messy data to beautiful graphs in a click, Graphy is the fastest way to tell stories with data.
Graphs
All graphs
Graphy Technologies Ltd. 2025. All rights reserved
The AI Graph Maker
From messy data to beautiful graphs in a click,
Graphy is the fastest way to tell stories with data.
Graphs
All graphs
Graphy Technologies Ltd. 2025. All rights reserved
The AI Graph Maker
From messy data to beautiful graphs in a click,
Graphy is the fastest way to tell stories with data.
Graphs
All graphs
Graphy Technologies Ltd. 2025. All rights reserved