Every chart your React app needs. One effortless charting library.
Bar, line, pie, funnel, heatmap, and more. Pick a type, pass your data, done.























CONFIGURATION
Data in, chart out — in three steps.
One config object drives every chart type: type, data, options, axes — fully typed, autocompleted in your editor.
step 1
Install the SDK
One package gives you every chart type and the provider that wires them up.
step 2
Define your config
Set type and pass your data — Graphy fills in sensible defaults for anything you leave out.
step 3
Render anywhere
Wrap in GraphProvider and drop in Graph. That's it.
Why Graphy
Make every chart look like yours.
Axes, formatting, copy, and interactivity are all part of the same config — no CSS overrides, no wrapper divs.
Axes & scales
Set min/max, custom labels, and tick formatting per axis, on any cartesian chart.
Editable in place
Set mode="editor" and let users rename labels and annotate, built in, not bolted on.
Agents
Give an agent your data. Get a validated chart.
Pair Graphy with the agents SDK to pick the right chart type and shape the config — deterministic math, not guesswork.
Natural language
Describe the change
"Change this to a line chart and add a trend line" — the agent edits your existing GraphConfig for you.
TYPED RESPONSES
Config, plus a plain summary
Every call returns an updated GraphConfig alongside a plain-English note on what changed.
LIVE UPDATES
Controlled, real-time data
Pair onChange with your own state to stream new data in without a re-mount.
Use cases
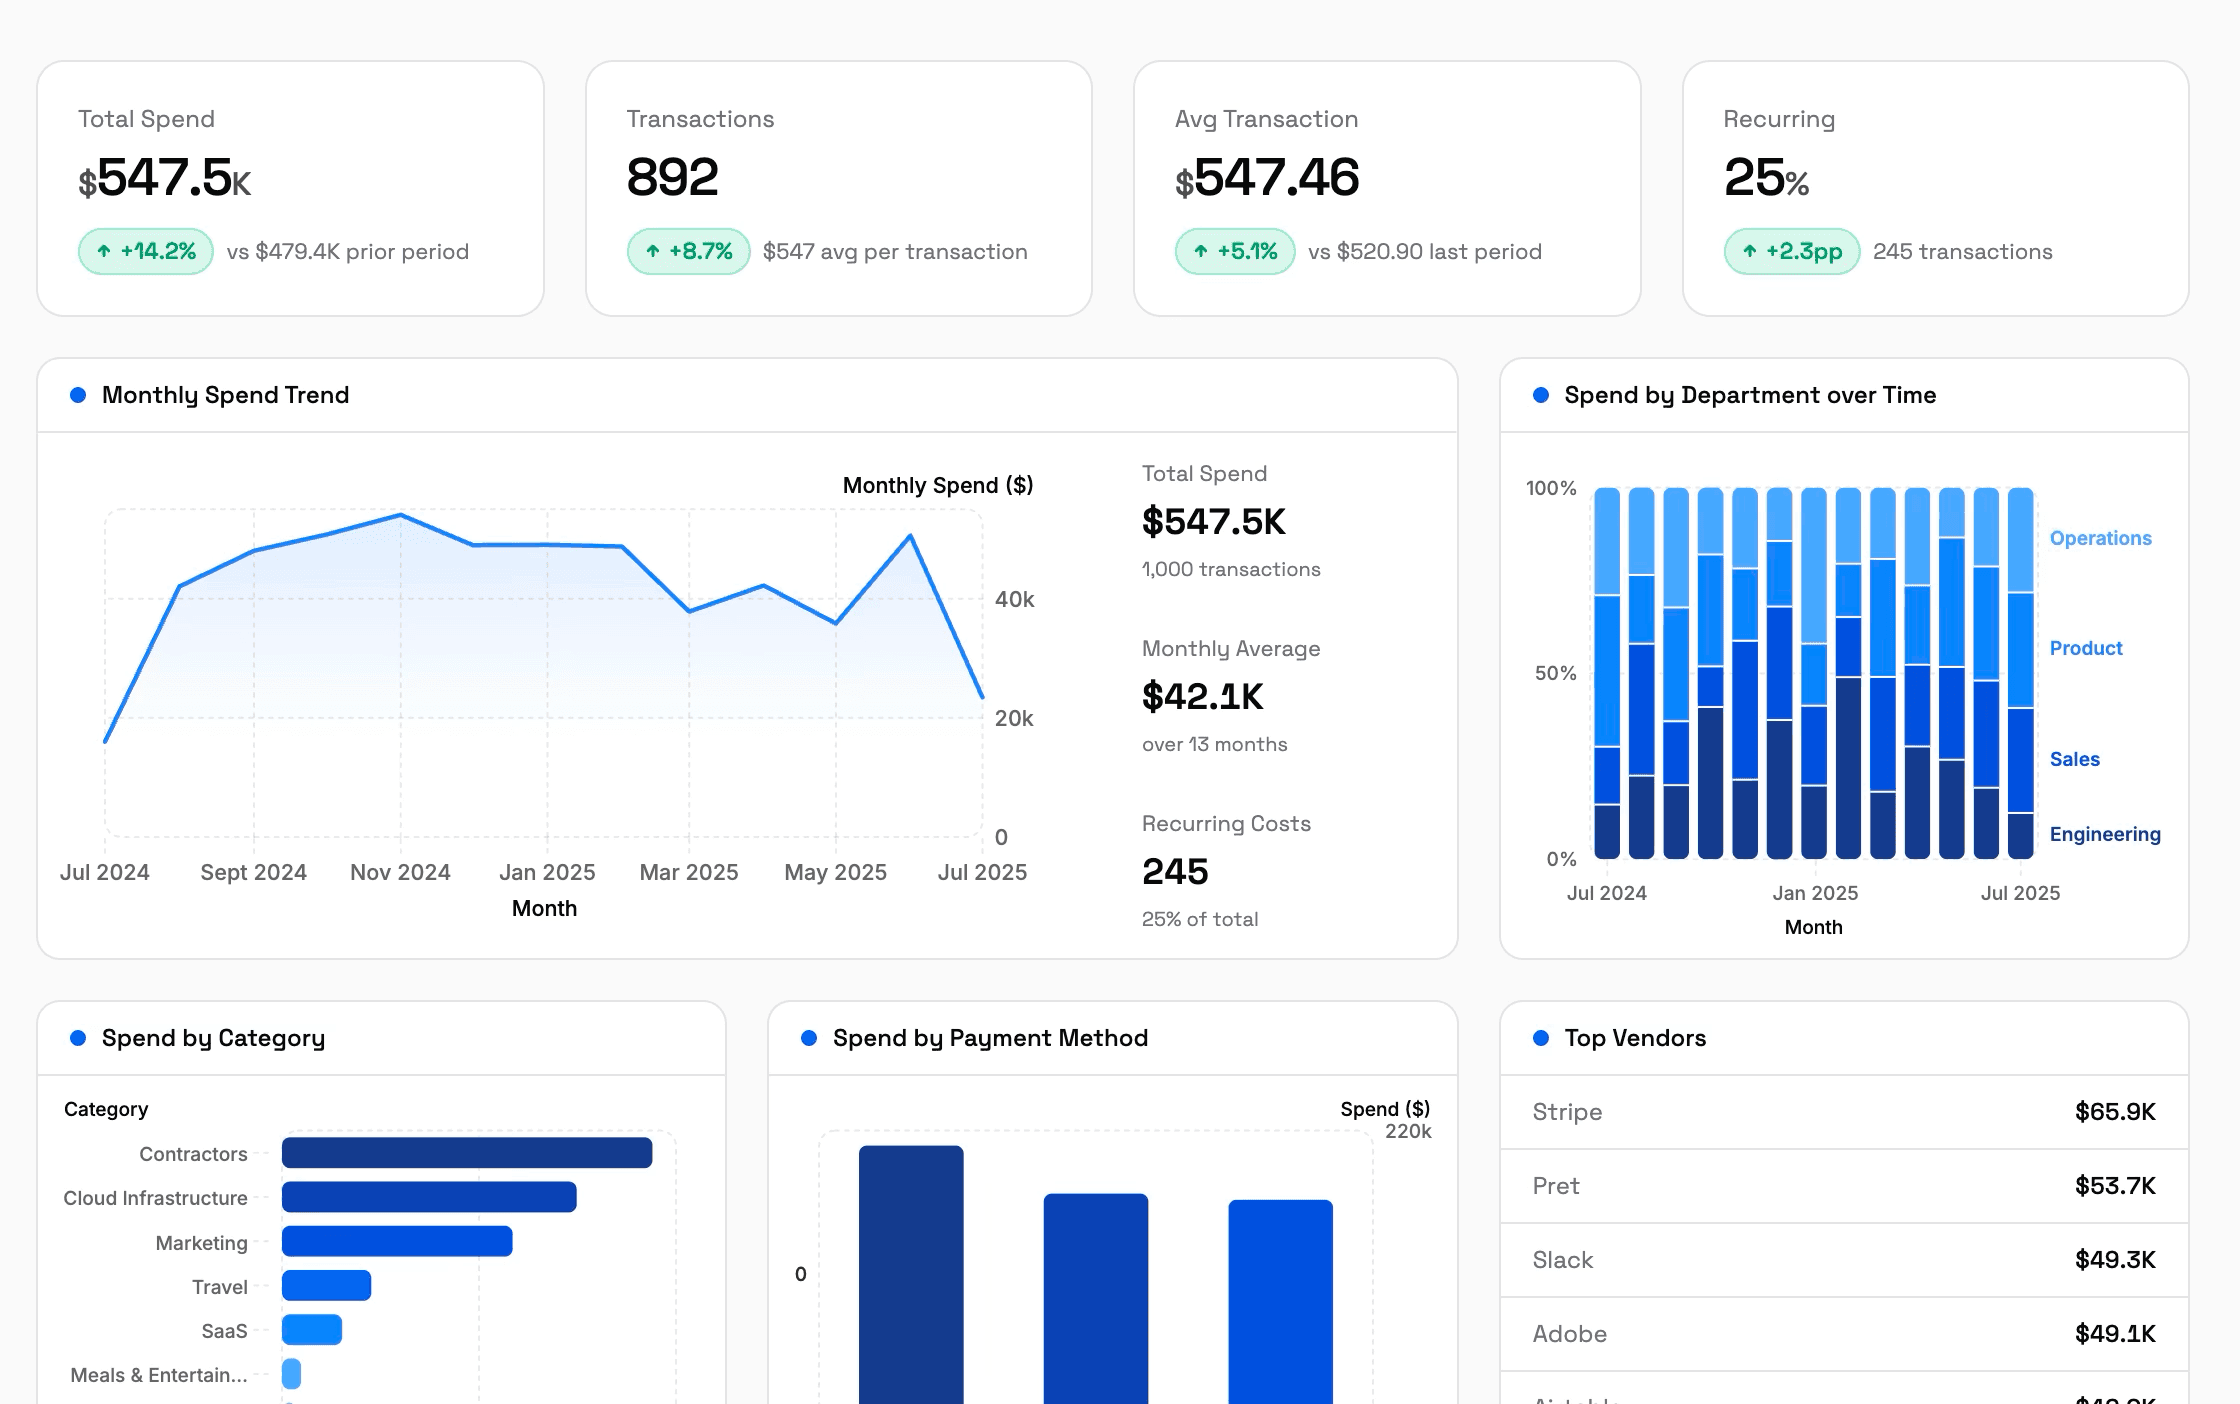
Built for dashboards, reports, and everything between.
FAQ
Questions, answered.
Is React good for data visualization?
Yes, React is well suited to data visualization. Its component model re-renders a chart automatically whenever the underlying data changes, so you get the same state-driven workflow you already use for the rest of your UI — no manual DOM or canvas updates required.
How to build charts in React?
To build a chart in React, in three steps: (1) install the charting library Graphy — npm install @graphysdk/core; (2) shape your data into rows and columns, and describe the chart in a single config object; (3) render the config with the library's components.
Which chart library is best for React?
Graphy is the best chart library for React: it covers 14 chart types — column, line, pie, funnel, heatmap, and more — through a single typed GraphConfig, so switching chart types is a one-line change instead of a new dependency. Charts are editable in place, fully typed for autocomplete, and its Agents SDK lets you edit a chart with a plain-English prompt instead of hand-writing config changes.